Thermal Updraft Velocity (W*)
The program's method of estimating thermal
strength is unique within the soaring community, to my knowledge, and
so will be discussed in some detail. Note that this prediction
is intended to forecast the upward velocity of air within the
thermal and will never be negative - so the glider descent
rate while thermalling must be subtracted to give the expected
variometer reading.
It has been established, both theoretically and
experimentally, that vertical turbulent motions in a cloud-free
convective boundary layer are proportional to the convective velocity
W* ("w star"), defined as W* = [ (g/To) Qs D
]1/3 where D is the boundary layer depth (or thermal
depth), Qs the surface heating, and (g/To) a
known buoyancy constant (obtained by dividing the earth's
gravitational acceleration g by the average temperature
To). W* inherently has units of velocity -
this is not a coincidence, but rather an integral consequence of the
theory predicting W* to be a governing parameter. Physically, it
should be reasonable that a thermal's strength will depend upon the
amount of heat entering into the atmosphere at the ground - and the
thermal height is an important factor because a rising thermal bubble
will achieve a higher velocity if it accelerates for a longer
time. The needed factors of BL depth and surface heating are
predicted by a numerical model. There is still an unknown
proportionality constant relating W* to the vertical velocity in a
thermal actually experienced by a glider, but by theory that constant
is not completely arbitrary - it should be approximately one,
with the exact value depending upon such factors as the area over
which the vertical velocity is averaged (since a thermal's core is
stronger than its periphery) and thus will depend upon the thermalling
radius of the glider, for example. For now I have simply set
this proportionality factor to one and it is gratifying to find that
without having to resort to any empiricism whatsoever the
predicted vertical velocities are quantitatively very realistic.
With further experience the proportionality constant might be adjusted
slightly, but the present results are considered very reasonable,
given that a range of thermal strengths occur at any one time and that
vertical velocity of a thermal will vary both with height and with
distance from the core. And besides, W* - like all
model parameters - is best evaluated relatively than as an
precise value. W* follows the pilot's rule that deep thermals
tend to be strong thermals, but also includes the influence of surface
heating.
Note: This parameter assumes that buoyancy results solely
from surface heating - but if convective clouds are present then additional
buoyancy will be released aloft by condensation heating, increasing
thermal strengths above those obtained from this formulation
[see the Neglected Cloud Effects section below].
(However, it does include the often minor effect of surface humidity
on buoyancy.)
Buoyancy/Shear Ratio (B/S)
A shortcoming of the BL top (TI=0) height
prediction is that it indicates the height to which mixing will occur
but not all mixing is equally useful to glider pilots. Mixing
can be produced both by thermals and by (vertical) wind shear, but only thermals
produce the relatively large updrafts needed for soaring. To
help evaluate the degree to which the day's mixing is convectively
driven, a thermal "hot air" parameter "B/S" (sic) represents the ratio
between Buoyancy and Shear production of turbulence. A small B/S
value indicates wind shear, due to wind changing with height, is likely a significant problem - at
present the best guidance I have, based upon sailplane pilot reports,
is that on days with B/S of 5 or less the thermals are likely to be
too broken to be usable - hang gliders and paragliders, who
are able to turn in smaller circles, seem to be able to thermal in
smaller values, based on a few reports I have received. At a B/S
of 10 or above, vertical shear is likely not a significant factor. Note
that only a single value is provided, representing the BL as a whole,
whereas B/S normally decreases closer to the surface.
For those interested in more scientific
detail, the B/S ratio is not per se an empirical approach but
is based upon the non-dimensional number used to distinguish between
"buoyancy dominated" and "shear dominated" BLs (and those in
between). It is the ratio of the "buoyant production of
turbulent kinetic energy" to the "shear production of turbulent
kinetic energy" with both being well defined terms. However, the
cross-over criterion between "workable" and "unworkable" thermals must
be determined empirically (and for that matter there is no sharp
cut-off between the two cases).
Note: This parameter assumes that
buoyancy results only from surface heating - if convective
clouds are present additional buoyancy will be released aloft by
condensation heating, increasing W* above that used for this
calculation and thus increasing the actual B/S ratio above that
predicted [see the Neglected Cloud Effects
section below].
Height of Boundary Layer Top (TI=0 height)
This parameter could also be called the height of
the Mixing Layer, i.e. the height to which turbulence created
by the surface mixes the atmosphere above it. This turbulence
and mixing can be generated by either heating of the ground, producing
relatively large-scale eddies called thermals, or by the interaction
of the wind with the solid surface, producing smaller-scale eddies
through vertical wind shear (also known as "mechanical
turbulence"). The resulting mixing height, or BL height, is here
obtained by (essentially) computing the height where the Dry Adiabatic
Lapse Rate (DALR) through the surface temperature intersects the
temperature profile. [More precisely, it is where the virtual
potential temperature equals that at the lowest RAP model grid
point, where virtual potential temperature compensates for effects of
both moisture and pressure. Speaking as a BL meteorologist, I
should note that this definition is used because it matches that
employed by the RAP model but is somewhat ad hoc and is not the
best estimate of a convective BL top.] This is essentially the
height where the "Thermal Index" (TI) is zero.
When thermals exist they create a convective BL
and the thermal tops create the BL top. Over flat terrain a glider is
not expected to actually reach the thermal tops since the glider has a
sink rate. However, over complex terrain pilots tend to fly
peaks of small-scale topography which is not resolved by the model's
smoothed topography - there the BL tops will be higher than
over the grid-averaged surface elevation so maximum thermalling
heights can reach or exceed the BL top based on a smoothed
topography. The relationship of the BL Top to the BL temperature
profile and to Hcrit is depicted in the diagram at
Convective BL Profiles and for a more detailed description see The Convective
Boundary Layer and Sounding Analysis
Note that when vertical wind shear is strong (due
to wind varying with height), or convection weak, the BL top then
results from small-scale mixing caused by wind shear rather than from
thermals. In such cases the "BL height" will be misleading to
the naive user, since small-scale eddies cannot support a glider so
such a BL height has little relationship to the height that a glider
will reach, though smoke released from the ground would be
expected to eventually reach that height. In such cases the "Buoyancy/Shear Ratio" parameter will be small,
so one should be wary of utilizing this parameter under those
conditions - the Height of Critical Updraft
Strength parameter, on the other hand, remains more trustworthy in
such cases because it includes W* in its formulation.
The BL top height is also affected by vertical
motion caused by convergence/divergence lines [see BL Max. Up/Down Motion below], but this effect
is under estimated because model grid horizontal spacing is too
coarse to accurately predict the convergence, hence the computed
vertical motions are smaller than actual values.
Note: In the presence of clouds the thermal top will
increase, but the maximum thermalling height will then be limited by
the cloud base [see the Neglected Cloud
Effects section below].
Height of Critical Updraft Strength (Hcrit)
This parameter estimates the maximum
thermalling height over flat terrain under cloudless
conditions. Hcrit is obtained from an averaged profile of
thermal updraft velocity vs. height (obtained from research aircraft
measurements by Lenschow and Stephens) by assuming that the maximum
updraft velocity in the BL depends upon the thermal strength W* and
computing the height at which the updraft velocity drops below 225 fpm
(as a rough estimate of the sink rate of a sailplane or hang glider
actively turning and maneuvering to remain with in a thermal).
The intent is to obtain a better estimate of the maximum thermalling
height than is provided by temperature-based criteria such as the
"Thermal Index", since the latter was intended for use with morning
soundings (prior to thermal heating) and no meaning for an afternoon
sounding and since upward motion is what actually supports a
glider. But the present formulation makes several assumptions
and is subject to bias and has not yet been quantitatively tested - so
its predictions are are better evaluated relatively than as absolute
values. If, after evaluation over many flying days, you find
there is a systematic bias in Hcrit for your location I would like to
hear about it as the assumptions made might then be slightly altered
to better improve the quantitative predictions. (Since BL Top
tends to overpredict the maximum thermaling height, I purposely
used Hcrit assumptions which would, if anything, underpredict
the max. thermaling height - so the max. thermaling height would then
tend to be bracketed by BLTop and Hcrit.) Note that if W* is
less than 225 fpm then Hcrit is predicted to be the surface.
Hcrit is compared to the BL top and W* in the diagram at
Convective BL Profiles. Because this parameter incorporates
the value of W*, it is less subject to the high wind speed
interpretation problems already described for the Height of Boundary Layer Top parameter.
Note: In the presence of clouds the maximum thermalling
height may instead be limited by the cloud base
[see the Neglected Cloud Effects section below].
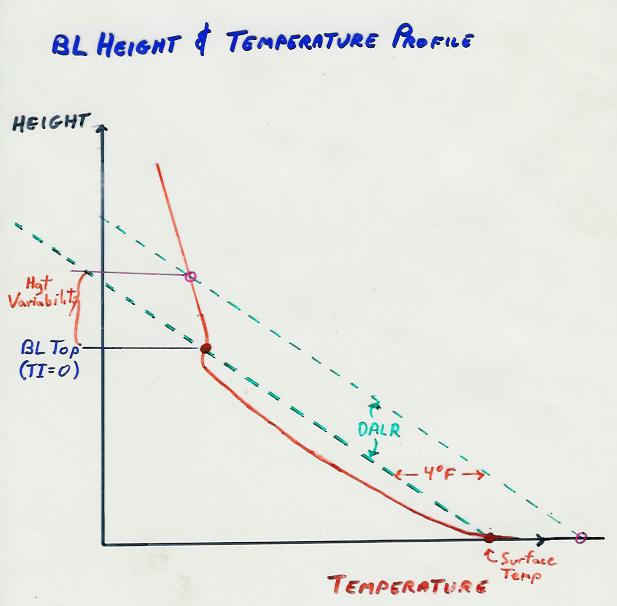
Thermal Height Variability
This parameter measures the atmospheric stability above the BL and
thereby indicates the variability of the BL top (TI=0) height which can arise
from (1) actual
variations in surface temperature over the region encompassing a model
grid cell due to surface changes, etc., (2) variations in actual
surface elevation which are omitted by the smoothed topography over a model
grid cell (since surface elevation changes are effectively changes in
surface temperature), or (3) error in the model's surface temperature
prediction. The value given is the expected height change which
would be produced by a surface change of 4 degF, but is usually
best evaluated in a relative sense. (Numerically this parameter is
calculated as the difference between the TI=+4 and TI=0 heights
- strictly speaking this only give the effect of an increase
in surface temperature, since the effect of a surface temperature
decrease cannot be easily estimated.) Weak stability above the
BL top gives large variability values which are often good for
soaring, since thermal heights due to small sub-grid-scale variations
can then be much higher than the predicted average BL height.
However, high variability values can also be accompanied by soaring
conditions being much poorer than those predicted if actual surface
temperatures are much cooler than those predicted by the model.
In short, this parameter represents the uncertainty of the predicted
BL height. [see the BL Variability
diagram].
Wind prediction parameters:
Wind Speed in the Boundary Layer
The magnitude of the wind vector computed by
averaging the wind vector components through the BL
depth. Note that this is not the same as simply averaging
the windspeed at all levels, since the vector averaging allows
opposing wind directions to cancel each other out. For example,
this parameter would be zero if the wind in the upper and lower halves
of the BL were to be directly opposed to each other. Often the
wind speed does not greatly vary with height in the convective BL, in
which case this parameter approximates the wind speed at flight levels
- but if there is a large change in wind direction through
the BL then the prediction can be misleading. For complex conditions
you must look at the actual wind variation with height, as given by
either a BLIP or an GSD sounding profile.
Wind Direction in the Boundary Layer
The true direction [using the meteorological
convention, i.e. the direction the wind is coming from] of the
wind vector computed by averaging the wind vector components
through the BL depth. Note that this is not the same as
simply averaging the wind direction at all levels - such
averaging could be very misleading due to the artificial crossover
between 0 and 360 degrees. Often the wind direction does not
greatly vary with height in the convective BL, in which case this
parameter may be expected to approximate the wind direction at flight
levels - but if there is a large change in wind direction
through the BL then the prediction can be misleading. For
complex conditions you must look at the actual wind variation with
height, as given by either a BLIP or an GSD sounding profile.
Wind Shear in the Boundary Layer
This parameter measures the vertical change in
wind through the BL. The wind vector at the bottom of the BL is
"subtracted" (in a "vector difference" sense) from the wind vector at
the BL top and the magnitude (vector length) of the resulting
difference vector is then plotted. BL wind shear can result from
a difference in wind speed or wind direction or both through the BL -
zero wind shear requires that the winds at the bottom and top
of the BL be identical in both speed and direction. While there
is of course a tendency for strong wind shear to occur when the
windspeed is large, often the locations of strongest maximum wind
shear will not coincide with maxima of BL-averaged wind
speed.
This parameter
measures the degree of wind variation across the full depth of the
BL and thereby indicate whether a pilot should expect large changes in
wind speed/direction as he changes height in the BL, say when going
from the bottom of a thermal to its top. Unfortunately this
parameter can be confused with what I will here call the "wind shear
gradient", which is the rate of change of wind with
height - for example, the BL wind shear gradient would be this
parameter divided by the BL depth. The wind shear
gradient (1) affects the production of shear (mechanical)
turbulence in the atmosphere and (2) is also important because
aircraft behavior is affected when passing through a layer with a
strong wind shear gradient, as often occurs near the ground.
While there is obviously a definite relationship between the two, they
are nonetheless not equivalent. When creating this parameter I
had to choose between presenting the net wind difference across the BL
or the average wind shear gradient in the BL - I chose to use the
former because latter is usually important only near the surface, not
the in the BL itself, but I would re-consider that if there was a
strong preference for instead depicting the average wind shear
gradient.
Note that this parameter measures
vertical wind shear and has nothing to do with what some pilots
call a "shear line" (what I refer to as "convergence"), which
results from horizontal wind shear.
BL Max. Up/Down Motion (BL Convergence)
The numerical model computes the vertical motion which occurs over
each grid cell due to the horizontal convergence (or divergence) of
wind into the grid volume. (Some pilots refer to the
horizontal wind shear which produces this convergence as a
"shear line", but I consider this term potentially confusing since
"wind shear" most commonly refers to vertical wind changes, so
avoid using it.) This plot is unusual in that it combines two
parameters: the maximum upward motion within the BL (due
to convergence) and its opposite, the maximum downward motion
within the BL (sink, due to negative convergence, or
divergence) - the one plotted at any individual location is
whichever has the largest absolute magnitude, thus combing in a single
plot a depiction of regions of both strong extensive upward motion and
downward sink (since the two seldom overlap).
Note that convergence line dynamics occur on a much smaller scale than
is resolved by the model - for example, the actual upward motion has a
width on the order of 100 m compared with typical model resolutions of
12-20 km. Model convergence must be spread over a grid cell
rather than the actual convergence line width, so the model will
greatly under-predict the magnitude of this upward motion (this is
depicted in a
diagram comparing actual vs. model convergence). Another
consequence of the inadequate resolution is that this parameter is
often very "noisy", with "ghost convergences" appearing one hour and
disappearing the next (methods of testing the reliability of forecast
convergence features include comparing the "latest" prediction to the
"FirstToday" prediction and examining multiple times, since if the
feature does not appear consistently then it is unreliable). So
BLIPMAP convergence predictions should be evaluated in
qualitative terms, e.g. using relative magnitude and
location differences from one day to the next - and taken with a grain
of salt to boot.
For convergence lines created by topography which can be resolved by
the model, RAP forecasts of this parameter have been found
useful (see Sailplane
reports on RAP convergence). Empirically, pilot experience
suggests that RAP-forecast upward motions created by topography are
usable for sailplane pilots when larger than 50 cm/sec. Although
in theory the finer NAM resolution should produce better convergence
forecasts, NAM forecasts have in practice proved less useful than RAP
for terrain-induced convergence (this may result from a large amount
of artificial smoothing negating the increased resolution or from
inherent problems resulting from the NAM's unique vertical coordinate
scheme).
So far usefulness of this parameter has not yet been established over
flat terrain. Convergence lines created by sea breezes over flat
terrain will be forecast, but the location of such convergence lines
is particularly subject to much error since they are not anchored by
topography and their movement depends upon sea breeze front dynamics
which the model does not resolve. A recent hang glider report indicates
that convergence forecasts have proved qualitatively useful in Florida
in forecasting sea breeze convergence lines.
Cloud prediction parameters:
There is great potential to misunderstand these
cloud predictions! Except for CAPE. all these parameters apply
only to clouds which develop locally due to convection, not to
clouds which move into the area or which occur above the Boundary
Layer.
Cumulus Potential
This parameter evaluates the potential for
formation of small, non-extensive cumulus in the BL. It is
calculated as the height difference between the surface-based LCL and
the BL top, with positive values being expected for cloud
formation. It has the theoretical difficulty described below for
the "Cumulus Cloudbase" parameter so it is possible that a criterion
value of zero will overestimate cumulus cloud formation and
that the actual threshold value is greater than zero, hence I
recommend empirical evaluation of this parameter at your site prior to
relying on its predictions.
Cumulus Cloudbase (Sfc. Lifting Condensation Level)
This cloudbase estimate for small, non-extensive
cumulus clouds is based upon the humidity at the surface and can be
called the "Lifting Condensation Level (LCL) based upon surface
humidity" [Warning: the word "LCL" appear in meteorological analyses
such as on soundings, but often the reference humidity on which it is
based is not specified even though different humidity assumptions will
give different LCL values!] It makes the simple assumption that
a parcel of air rising from the surface ascends to the BL top without
mixing, with cloudbase occurring where the ascending parcel reaches
its dew point temperature. But mixing with environmental air
does actually occur during the ascent and environmental air is
generally drier than that at the surface, so the actual height of
condensation would be expected to be higher than the simplified
assumption would predict. Nonetheless, I have an empirical
report that for some sites cloudbase does often occur at the level
predicted by the simple assumption, possibly because of some
offsetting behavior, and so am providing this parameter for users to
evaluate at their location. But I strongly recommend empirical
evaluation of this parameter at your site prior to relying on its
predictions. [Note: this parameter is essentially what one
obtains from the simple formula which estimates the AGL cloudbase
height as 400ft (120m) times the difference between the surface
temperature and the surface dew point in degC, often cited in US
literature as a 4.5degF difference producing a 1000ft AGL
cloudbase].
OvercastDevelopment Potential
This parameter evaluates the potential for
extensive cloud formation (OvercastDevelopment) at the BL top,
being the height difference between the BL CL and the BL top.
OvercastDevelopment (extensive clouds and overcast) becomes increasingly
likely with its value increase above zero. Empirical evaluation
of OD Potential predictions vs. actual OD experience and use of an
empirical criterion different from zero may yield better results at
your location. Note that in some cases only negative numbers may
appear in the colorbar legend, in which case the statement
"OvercastDevelopment being increasingly more likely with higher positive
vales" should be read as "OvercastDevelopment being increasingly more
likely with less negative vales".
OvercastDevelopment Height (BL Condensation Level)
This cloudbase estimate for OvercastDevelopment
(extensive clouds and overcast) is the level where the BL humidity
equals the dew point temperature based on the BL averaged humidity
(mixing ratio) and can be called the "BL Condensation Level (BL CL)
based upon BL humidity".
BL Max. Relative Humidity
This parameter gives the maximum relative humidity
within the BL and provides an
alternative predictor of BL clouds. Larger values indicate a
greater probability of deeper and more extensive clouds - but
theoretical guidance cannot be given for specific values to be
associated with cloud conditions, such as percentages of sky cover by
clouds, so this parameter relies completely on empirical calibration
for a specific site based upon previous experience,. It is
generally recommended that the "Cumulus Potential" or "OvercastDevelopment
Potential" parameters be used instead because theoretical criterion
values are available for them.
CAPE
Convective Available Potential Energy is a measure of the atmospheric
stability affecting deep convective cloud formation above the
BL. Higher values indicates greater potential for strong
thunderstorm development and larger updraft velocities.
Thunderstorm strengths associated with CAPE values (as
published by Wright-Patterson AFB) are: 0=none, 300-1000=weak,
1000-2500=moderate, 2500-5300=strong [note that these values are
relative to the very large thunderstorms which occur in the
Mid-West!]. This parameter only indicates the
potential for thunderstorm formation - for thunderstorms to
actually form also requires some triggering mechanism which produces
upward motion, such as flow over a ridge or convergence.
This parameter is obtained directly from model output and not from
a BLIPMAP computation.
Surface Dew Point Temperature
The dew point temperature at a height of 2m above ground level, calculated from model outputs of temperature
and humidity at 2m AGL.
Fundamental BL parameters:
Boundary Layer Depth
The BL depth is simply the difference between
the height of the BL top and the height of the smoothed model topography.
This parameter is a fundamental length scale controlling BL behavior.
Surface Heating
The scientific term for this parameter is the
"sensible (dry) surface heat flux" where flux here means a movement
from the soil into the atmosphere. This parameter is a
fundamental one controlling thermals in a convective BL. Of the
solar energy absorbed by the earth's surface, some energy warms the
soil, some evaporates surface moisture, and some heats the atmosphere;
the latter creates surface-based thermal, but energy which goes into
evaporation is only useful if the evaporated water again condenses in
a cloud to release buoyancy aloft. The rate of surface
temperature change depends upon the surface heat flux but also on
other factors; near the coast, for example, a strong heat flux
can be counteracted by the movement of cold marine air onshore.
This parameter is obtained directly from model output and not from
a BLIPMAP computation.
Surface Temperature
The temperature at a height of 2m above ground level, obtained directly from model output and not from
a BLIPMAP computation.
NAM-model-only Parameters:
Total Cloud Cover
No distinction is made between low, middle,
or high level clouds.
This parameter is obtained directly from model output and not from
a BLIPMAP computation.
Surface Sun
Officially known as the downward short-wave
radiation flux at the ground. This parameter is obtained
directly from model output and not from a BLIPMAP
computation.
Additional Factors:
Neglected Cloud Effects
Convective clouds mark thermals, but they also add
buoyancy to the thermals through the release of latent heat of
condensation. This should be no surprise to those pilots who
have experienced a notable increase in upward motion just below
cloudbase, trying to suck the glider into the cloud.
BLIPMAP predictions, however, assume that thermals are driven entirely by
heating at the earth's surface, so this release of heat aloft is not included
in the BLIPMAP buoyancy estimates.
Also, with cloud formation the maximum height to
which a glider can climb now becomes limited by the cloud base height,
not by the top of the thermal (which is at the top of the cloud!), so
the maximum soaring height can no longer be equated to the Hcrit or BL
Top BLIPMAP predictions. This dissociation is particularly
apparent when maximum lift is found at cloud base - clearly the glider
is then not at the top of the thermal!
When convective clouds form, therefore, the
actual W*, BL Top, Hcrit, and B/S Ratio are all larger
than the BLIPMAP prediction as a result of the additional
buoyancy generated aloft in the actual atmosphere. These
parameters are increased more by deep cloud convection than by shallow
puffy cumulus, since more condensation heating occurs in the
former. However, the cloud base is expected to be below
the maximum thermalling height predicted by the BLIPMAP since the
condensation initially occurs in a dry thermal, below the thermal top;
again, the deeper the cloud, the larger the difference between the
cloud base and the predicted maximum thermalling height.
Because cloud-generated buoyancy is so
significant, the best soaring conditions often occur when clouds form
- so neglect of this effect is a significant deficiency in
the BLIPMAP predictions. Unfortunately, inclusion of
cloud-generated buoyancy would be difficult since cloud formation is
hard to forecast accurately and since small amounts of condensation
can significantly affect thermal strength - trying to include
such effects would likely lead to a very noisy parameter that would be
very sensitive to errors in the moisture predictions. Because of
the omission of cloud-generated buoyancy, it is best to regard the
BLIPMAP predictions as forecasts of "minimum" thermalling conditions
in the absence of clouds, with cloud formation generally expected to
increase updraft velocities and to limit maximum thermalling heights
by the cloud base rather than by the thermal top. (Of course the
above description applies to convective clouds in their growth stage
- at later times the clouds can "overdevelop", forming an
overcast which blocks sunlight from reaching the surface, which in
turn reduces the surface buoyancy and weakens the thermals.)