Grid Orientation Information
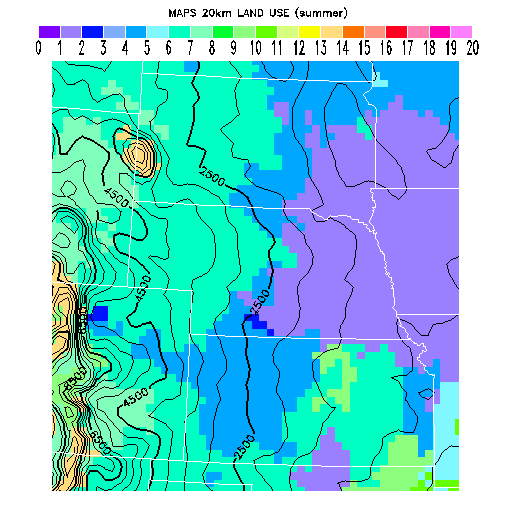
The following maps are provided to aid orientation with respect to the smoothed model
topography:
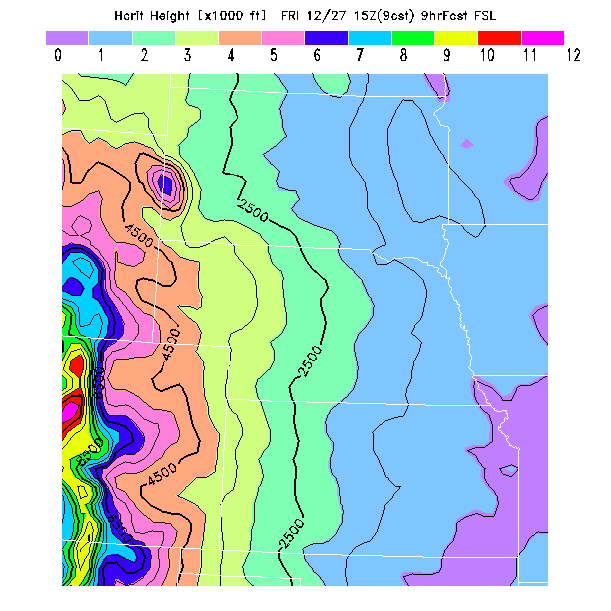
Smoothed Topography Warning: Use of an exact lat/long can
be misleading in complex terrain
Pilots are used to having a specific lat/long be
associated with a real-world surface elevation, but a model uses
smoothed topography and so can have a significantly different
elevation at that point - and it will predict conditions based upon
that elevation, not upon the real-world elevation. In the
presence of complex topography the model topography can differ
significantly from the actual topography and when that occurs the
model predictions should be interpreted relative to the model terrain,
not with respect to the actual terrain. This is the reason
why the model topography, not the actual topography, is depicted on
all BLIPMAP plots - this is a feature to help produce better
forecast interpretations.
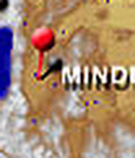
One consequence of smoothed topography is that the influence of
small real-world features is absent from the model predictions. For
example, pilots flying out of Minden are familiar with the Pine Nut
Mountains to the east, which are often used a jumping off point.
But the Pine Nuts are too narrow to be represented in the smoothed
topography so conditions over their ridgeline are simply not predicted. The
figures below compare the actual and model topography for the Minden
area, where the Pine Nuts lie beneath the "M" in the actual topography image.
Another consequence of smoothed topography is
that there can be a prediction location "fuzziness" when the model
surface elevation differs significantly from the real-world
elevation. Because the atmosphere varies much more rapidly in
the vertical than in the horizontal, the model prediction which "best"
fits a given real-world location will then not be exactly at the model
lat/long identical to the real-world lat/long but instead at some
nearby location where the model surface elevation more closely agrees
with the surface elevation of the real-world location. This
"fuzziness" is negligible for relatively flat regions but can be
significant where there is a rapid change in topographic height -
in complex topography a displacement of 11 nm (1 grid point) is not
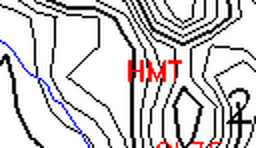
unusual. For example, the figure below illustrates the model
topography for the Los Angeles region with the actual location of
Hemet located at the "M" of "HMT". This model location has a
surface elevation of 2700 ft but the actual elevation of Hemet is 1512
ftMSL. Hemet lies in LA's eastern basin just to the west of the
San Jacinto Mts and what has happened is that the smoothing of those
mountains has increased their width artificially, raising the surface
elevation at Hemet's location. In this case a better forecast
would be obtained by using a location in what the model recognizes as
the LA basin, i.e. just to the left of the "H" where the model surface
elevation is much closer to the actual Hemet elevation.
Similarly, a model terrain ridgeline can be
displaced from the location of the actual ridgeline, particularly if the
ridge is very asymmetric as the Sierras are. In such cases
predictions are best made relative
to the model ridgeline, not from the lat/long of the actual ridgeline.
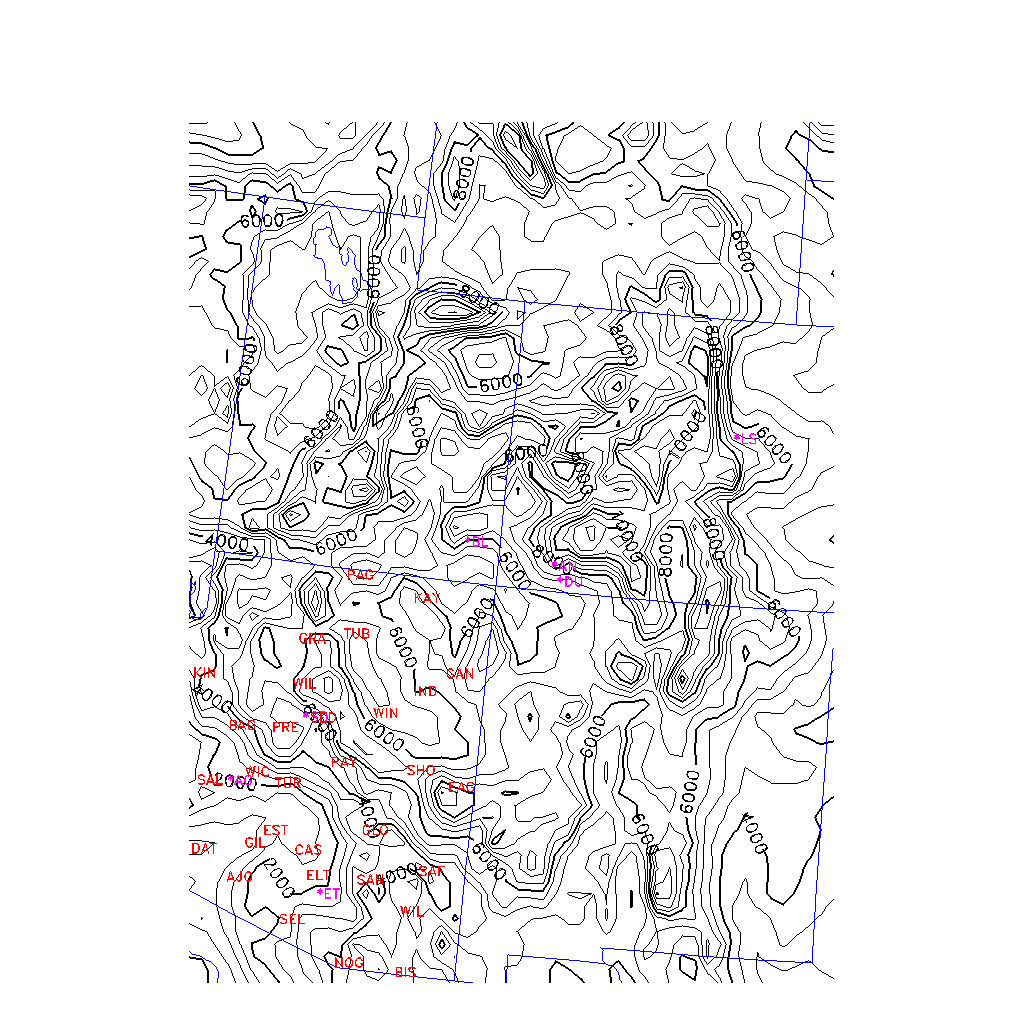
In short, one must be cautious when examining
weather predictions at some exact lat/long, and this is the reason why
the smoothed model terrain contours, not real-world terrain contours,
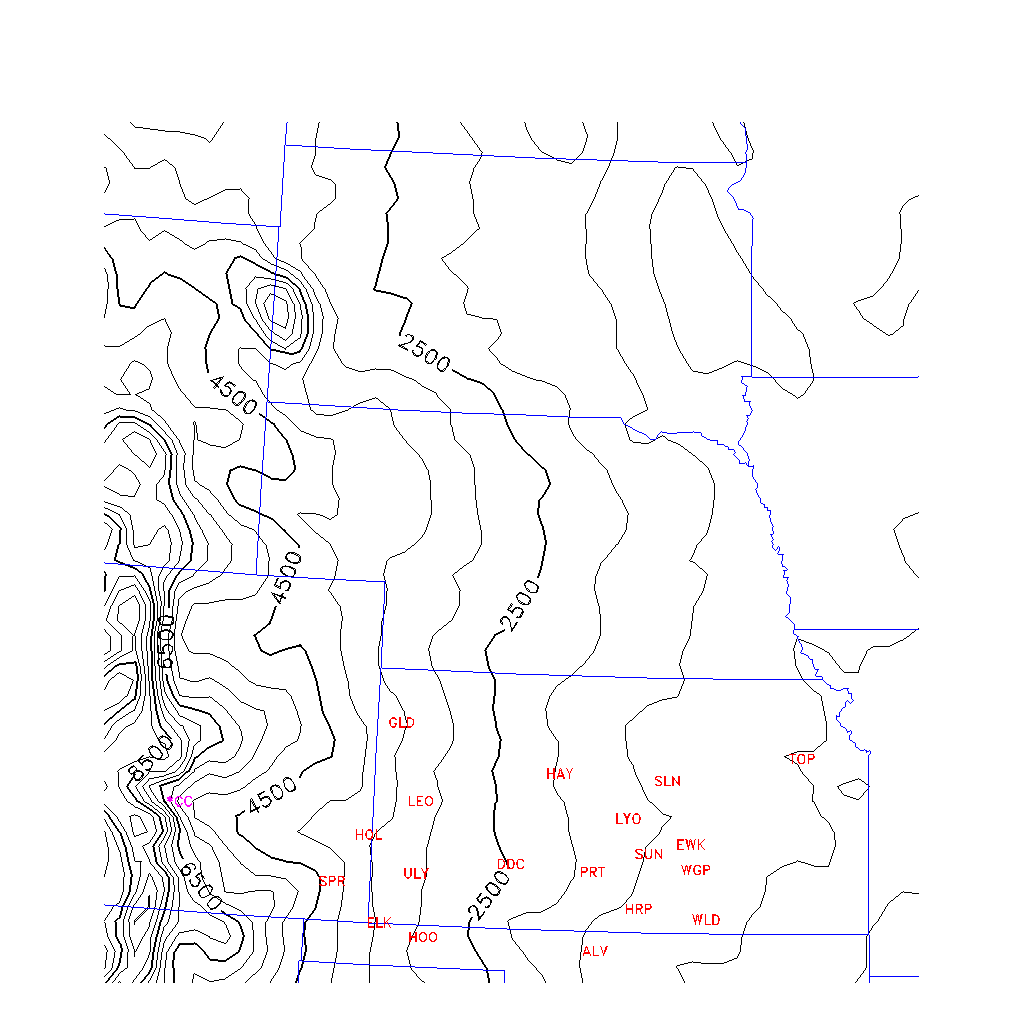
are displayed on BLIPMAPs. The "identified locations" map places
identifiers at the actual lat/long associated with each location, but
pilots are expected to have the sophistication to recognize that model
predictions are obtained from smoothed topography and appropriately
evaluate those predictions in light of that topography. These
model limitations are reduced when topography resolution is increased,
as in the ETA model, but will always be there to some extent.
The sophistication required to use BLIPMAP
predictions properly in the presence of smoothed
topography effects can be likened to trying to center a thermal
using a variometer - there is a valuable signal in the variometer
readings, but they are best interpreted not from the instantaneous
readings directly but by also considering the instrument's lag time
and associating each reading with where the glider was at some time
previously, not where it is now. In other words, the values must
be interpreted in light of other knowledge - which in this case is knowledge of
the model topography - not simply read and used without further evaluation.
Also note that BLIPSPOTs are plotted at the grid
location actually utilized for their predictions which, also due to
the smoothed topography, may differ by up to one grid point from the
lat/long of the location after which they are named.
If an "Identified Locations" map do not exist for your region or if you would like to add plotted locations for your area:
To get location IDs from your state or area included on your regions's "Identified Locations" map, do the
following:
- Let me know of the area you plan to cover (hopefully at least a quarter of the regional
map), so that there will be no duplication of effort
- Create a text file with each line containing the location ID, name,
latitude, longitude, and your name as per the following example. Do not
include locations which are very close to one another, since the identifiers will
then overlap - to see the size of the plotted IDs, see this
location plot example
which is based on this
input data example
.
      ID   LOCATION (with state)    LATITUDE LONGITUDE  YOUR_NAME (AND ANY OTHER USEFUL INFO)

      MEV  Minden NV                39.0003  -119.7508  Jack Glendening

      TRK  Truckee CA               39.3200  -120.1396  Jack Glendening
- Send me your list by email - it's best to send a text file with your data as
an attachment rather than as part of the email body, since the latter often garbages up
the text columns (MS Outlook Express does, at least). I will then create a plot from your data, post that map,
and send you an email when that is done so you can view the resulting plot on the website.
If you are not satisfied with that map, send back an edited list and I will do a
replot - but please do not expect me to do re-plot after re-plot.
