EXPERIENCE SUMMARIES
Hemet, CA - March 13, 2004
[Taking a long tow, if you know where to go]
BL top and Hcrit in the Hemet area said, at least to me, that
soaring in the immediate vicinity of Hemet would be poor. A few miles east in
the Idylwild area however, and running a considerable distance north and
south, the prediction was for excellent conditons.
Treating the Blipmap as gospel, I took a long tow east, found strong lift in
the areas predicted, flew for 3 1/2 hours between 14,000 and 8,000 feet a
total distance of 125 nautical miles.
It is my understanding no one else got away from Hemet. I fielded several
calls from pilots on the ground, asking how I did it, and heard a half dozen
calls for relights.
As another Jack said so well, this is as good as it gets.
Thanks Robert L. Hunter
Williams, CA - Mar 6
[Use of BLIPMAP for finding and flying terrain-generated convergences]
Blipmap Forum posting by Milt Hare: USER GUIDE: BL Upward Motion Max
Phoenix, AZ - Feb 10
[Winter cross-country forecast]
I just
thought you'd like to know that Dr. Jack's Blipmap forecast showed
showed unexpectedly good soaring conditions in Arizona on Sunday after
the passage of a low. Although the predictions were viewed with
skepticism by quite a few, since the air was completely dead around
noon, trigger temperature was reached about 12:30 and thermals began
to develop. A half-dozen of the ASA members launched at 1:00
p.m.and found 4-knot thermals to 3,000 ft AGL. We flew a 75 to
100-mile cross country, finding occasional 5 and 6 knot thermals, the
odd one topping at 8,000 ft MSL. Cross-country in
February - not bad! Most useful, though, the Blipmap forecast
was spot on! Mike Stringfellow ASW 20
Monticello, IL - Jan 2, 2003
[Here is what I would most like to achieve.]
Dear Dr. Jack,
Your maps have made flying our central Illinois conditions easier, more
predicable and FUN.
Regards, Rod Pool
Peoria, AZ - Dec 24, 2002
[Another comparison to another FSS soaring forecast.]
Dr Jack
Thanks to your excellent BLIPMAP forecast I was able to make a nice winter
thermal XC flight on X-mas eve. The FSS Soaring Forecast was predicting poor
conditions, but with the passage of a Low Pressure system I had the feeling
it was going to be a good day - which the BLIPMAP forecast predicted.
Flight: from Turf Soaring, Peoria AZ to Wickenburg, AZ and return for 100KM
in 1:45 ...
Thanks again for this wonderful forecasting tool!
Tony Smolder
[Note that Tony first used his knowledge that passage of an upper level trough or front often
brings good soaring conditions. Of course not all lows/fronts are created
equal so some produce much better/poorer conditions than others - BLIPMAPs provide
info on which ones will give the better soaring.]
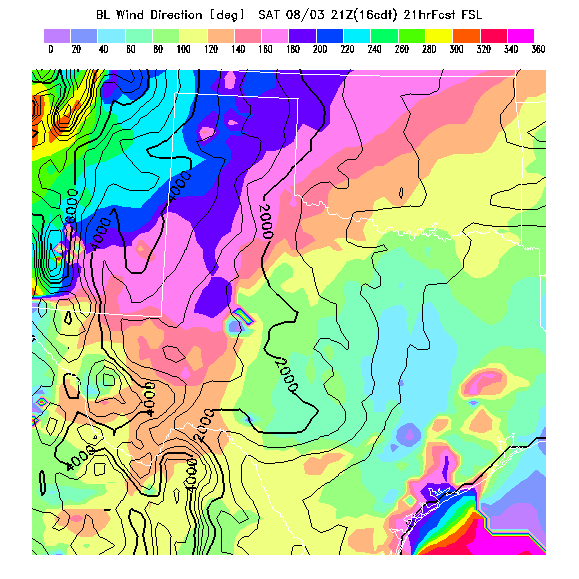
Big Spring, TX - Aug 2, 2002
[An example of small-scale model noise: I happened on this case
after seeing a report of a "bogus" GSD wind direction forecast
at Big Spring, TX during the HG US Open.
The
boundary-layer-average wind direction forecast map for that day
shows two "bulls eye" patterns near Big Spring (found by extending the
East-West TX-NM border further east to the middle of the panhandle
region), their size being that of a model grid cell, which are a characteristic of small-scale model noise and indicate
untrustworthy results there. But the surrounding area is noise-free
and a human looking at the plotted results above can recognize the
model noise and use the brain's pattern recognition ability to infer
reasonable forecast winds for Big Spring. This illustrates one
advantage of using a wider area forecast rather than just conditions
forecast at a single point.]
Hollister, CALIFORNIA - Nov 9, 2002
The best
example of a recently created forecasting summary for a specific
site that I have found is at http://www.flybasa.org/blipmap.htm
and I encourage others who have local forecasting knowledge/experience
to create a similar summary for their site so those with less
forecasting experience can benefit and get to the field when good
soaring is predicted. What I particularly like about this
summary is that (1) it describes specific local BLIPMAP forecasts
which have been found to be accurate and most useful but also mentions
locally-determined weaknesses, and (2) it discusses the use of NOAA
products which can be combined with BLIPMAP forecasts. In fact,
the NOAA products it mentions are those which I use myself: the
Forecast Discussion to get a human interpretation of model results and
their anticipated reliability, the Terminal Aerodrome Forecast for
its cloud height predictions, and satellite photos for early AM real
world observations. I was particularly impressed that Harry Fox,
who flies with the Bay Area Soaring Associates, has described
everything perfectly accurately, since I often have quibbles about
pilot-written descriptions. And I was pleasantly surprised to
find that it was written for the site I presently fly out of since I had
no foreknowledge of it! [The summary mentions BLIPs and TIPs,
which are presently only available for certain CA locations - however,
additional BLIPs may be created nation-wide next summer.]
Frederick, MARYLAND - Oct 24, 2002
[A
season-end report comparing BLIPMAPs to actual conditions.
Now that the summer soaring season is over, I
encourage other pilots to send a report summarizing BLIPMAP
performance, both successes and weaknesses, at their site.]
Dr Jack On the 10 or so days that I have flown where there
has been BM forecasting, I have been very impressed by the overall
accuracy. I'd estimate that the BMs are running in the vicinity
of 85-90% accurate or better. Especially impressive is the
consistently good call on the height of thermals. The BMs are
considerably better than the IAD (Dulles AP) thermal index-based
soaring forecast, which has a f/c accuracy down in the 50% range at
best. The TI soaring forecast is so unreliable that years ago I
stopped regularly looking at it. Bill Whelan
Minden, NEVADA - Sept 16, 2002
[I don't generally post individual cases, but everyone is intrigued
by head-to-head comparisons and I later received additional reports for Truckee
and a wider area around Minden indicating agreement with this
comparison. So here is a comparison to the Reno NWS's
"Soaring Forecast", which is based solely on the AM Reno
RAOB.]
Dr Jack Yesterday your blipmap was calling Minden 12 to 13 K with 700 fpm of
updraft. Reno soaring forecast said [over] 18K with 1.5 K of
up!! Talk about disparity!!!
Unfortunately the blipmap was right and I struggled around the Carson
Valley and over the Pinenuts never getting much over 11 K.
bumper [John Morgan]
[The site-specific BLIP forecast for Minden gave mid-day
maxima for Hcrit, BLtop, and W* of 10800 ft, 12792 ft, and 622
fpm. I should note that the Reno Soaring Forecast will _never_
predict a soaring height above 18kft - the NWS, in its wisdom,
artificially truncates its "maximum altitude" forecasts at the FAA's 18kft
airspace limit. The un-truncated thermal height would have been much
above 18kft. My TIP forecast for Minden uses a methodology
similar to the Reno soaring forecast for it's AM forecast and
gave Hcrit & BLtop of 20833 & 23785 ft - but the TIP also
includes a PM forecast based on model soundings, which indicated a PM
change of -7260 ft as an alert that the AM sounding forecast was a big
over-prediction. The bottom line is that this exemplifies a PM
model forecast being more correct than an observed AM RAOB due to atmospheric
changes after the observation time.]
Indianapolis, INDIANA - August 7, 2002
[An example of how the model can fill in gaps between the isolated
RAOB locations, often allowing better forecasts than can be obtained
from a non-local RAOB.]
Dr.Jack I have been using your BLIPMAP product all season and have been
constantly comparing to Kevin Ford's Soaring Forecast. Sometimes when
I have been unable to fly, I have checked the BLIPMAP and then
discussed it with some others who did. BLIPMAP has been consistently
more accurate than [non-local] RAOB based forecasts. Central Indiana Soaring
Society is based at Indianapolis- Terry (TYQ). The closest RAOB sites
are Lincoln, IL and Wilmington, OH. With the prevailing wind from the
SW, neither is really great. Wilmington data is often not available
as well. BLIPMAP has not only given us a better quality product, but
a more reliable one as well. Jeff Melin, 8C
Tucson, ARIZONA - June 17, 2002
[Here's an interesting thought on using BL Depth instead of BL
Top for race tasking]
Dr. Jack, Thanks again for the Blipmaps. We use them for
tasking the ASA [Arizona Soaring Association] racing
series. BTW we tend to use updraft velocity and BL Depth.
That eliminates the need to subtract ground elevation. Depth
tells us what our operating band will be, and that in turn tells us
how fast and how far we can go. (It also tells us if we can
safely fly over remote areas.). If one flies where the average
terrain is of similar elevation over the entire task area, then the
msl maps will work about as well (they essentially are depth
maps). But, we have an area up north and east were terrain
averages 5,000 msl (some large areas of 6,000 agl). To the west
and south it averages less then 2,000 (some large areas of 1,000
agl). So, the height maps are misleading unless one subtracts
the terrain elevation. Why would we do that manually when it's
readily available in the depth maps? I'm puzzled about why
pilots would want to use height maps. Alan Reeter
[DrJack uses the "BL Top" maps because they correlate with what he
is used to seeing on the altimeter and he knows what MSL altitudes are
useful at different locations - and he suspects other pilots operate
similarly Also, the MSL height is most useful when flying in
higher elevations where, in extremis, one will escape to a valley
having airports at much lower MSL elevations, even though the BL depth
may be small there (as when flying in the mts at the edge of
California's Central Valley). BL depth maps can be especially
useful when choosing which direction to fly if average surface
elevations vary greatly in those different directions. Users must
decide for themselves which maps best suit their individual
circumstances.]
Hollister, CALIFORNIA - May 18, 2002
[A long-term verification of thermal predictions over local
mountains from a very active cross-country LS-4 pilot.]
After using BLIPMAP and BLIP for almost a year I am happy to confirm
that it's accuracy is indeed truly amazing. My observations are
based mostly on the boundary layer top prediction for the
Panoche-Avenal shear [convergence] line. I believe the
boundary layer top is the most reliable and most informative indicator
of how good the day is going to be. I know many pilots talk
about thermal strength, but personally I don't think it says anything
about how good the day is... I can get in the shear line consistently
as high as the boundary layer top prediction (NOT the Hcrit!) give or
take few hundred feet. I am using both BLIPMAP to see the whole
picture, and BLIP for the Panoche and Hernandez area (it is not very
accurate for the Hollister area though, probably due to marine
influence). I actually make my decision to fly or not based on
it. Ramy Yanetz
[This is an example of empirical
BLIPMAP "calibration", determing by experience that over these local
mountains (for which the smoothed model terrain height is much lower
than the heights of small-scale peaks not resolved by the model, and
where a convergence line is often created by marine vs inland valley
air mass contrasts) the actual maximum thermalling heights agree best
with the BL top prediction (whereas over flat terrain the Hcrit
predictor is more likely to be the correct choice) For those
unfamiliar with this region, the importance of these forecasts is that
Panoche flights require a long aero-tow followed by a glide to reach
thermals which are beyond the marine influence, which often limits
thermal strengths near the airport itself. Strong Panoche
thermals will allow extended flights and a final climb to a height
sufficient to glide back to the airport - but if the thermal tops are
not high enough then one must land in a local field and get a
retreive. Ramy Yanetz is the person who first explored this new
soaring area, which now allows longer flights out of Hollister than had
previously been thought possible.]
Arlington, WASHINGTON - May 10, 2002
[The following is not a pilot report per se, but is included
because it indicates that better soaring weather awareness
can increase the number of non-weekend soaring flights, which is nice to
hear.]
Over the last 6 weeks or so since our Western WA folks have been
paying attention to the TIP and BLIP, we've been able to go soaring at
least once and sometimes twice on weekdays. On Wednesday, some
folks in club ships were getting to 6,100 feet and some in private
ships went into the mountains and got to 7,000 feet. And, we're
going again today. This also is helping to improve our club
finances! Dennis Eckert
Owl Canyon, COLORADO - May 10, 2002
[It's nice to get a report about the B/S (Buoyancy/Shear)
factor - determination of values which represent "workable" and
"unworkable" thermals must be made empirically, through actual flight
experience, and also depend upon pilot and plane capability.]
The area of Northern Colorado around Owl Canyon has a lot of boundary
shear... the boundary layer wind speed is often more than 30 Kts. in
the spring. Most of the time the forecast B/S is between 5 and 10.
Good pilots are able to climb in rough thermals as long as the B/S
ratio is more than 5. I have yet to fly on a day when the B/S ratio
is more than 10 or less than 4 so I can't say if that would indicate
that shear is a problem. Bill Daniels
[The reports below were posted prior to Apr 18, when it was
discovered that the height plotting routine was producing plots which
underreported heights by 500-1000ft, so the height predictions given
below have been increased by 500ft to provide a more correct
comparison between actual model predictions and achieved heights.]
Arlington, WASHINGTON - Apr. 2002
[Nice to get a report including a convergence prediction-vs-observation comparison]
Soaring in Western Washington is pretty iffy due to the stable marine
air so we mostly have a training operation at Arlington airport north
of Seattle. Forecasters were talking about the Puget Sound
Convergence Zone becoming active and since the most common location of
the PSCZ is just south of Arlington, I wasn't inclined to head for the
airport because the convergence area brings low clouds and showers.
Dr. Jack's BLIPMAP, however, looked really favorable as it was
forecasting the BL at 4500-5500K feet, thermals of 4-5 knots and, most
interesting to me -- predicting the convergence area well south of the
area. Sure, enough the convergence zone moved south of the airport
early in the morning and stayed over the City of Seattle. Most of our
club pilots are based in Seattle so they stayed home. Cloudbase was
4,200 to 4,700 and average lift was about 4 knots with vario peaks
around 6-7 knots. We had a nice one-hour flight in an L-13 and
private ships flew longer. Also interesting was the BLIPMAP showing a
fairly narrow north-south band of better lift. The private-ship folks
reported the north-south band was really working well so they pretty
much stayed out of the mountains. Great job, Jack! Dennis Eckert
[Dennis
has been studying soaring weather in the NW for many years,
as
might be apparent from the details in his report.]
Memphis, TENNESSEE - Apr. 2002
[Another report sent to the Memphis Soaring Society
illustrates the importance of timing, particularly for cloud behavior - if the clouds had not cleared
the forecast would have been a bust. Predicting cloud behavior
is difficult, so DrJack is feeling lucky in this case.]
The day started out looking very grim. Heavy cloud cover and it
looked like rain all morning at FCY. Dr. Jim Hendrix beat
Charlie to the gliderport with his glider. He wasn't going to
make the same mistake he made last Saturday. He had read the
BLIPmap with its prediction of 4500 ft thermals and 500fpm. thermal
strengths. Dr. Jim kept looking at the leaden sky and started
packing up his glider. He almost left but some blue sky appeared
in the South West. Some more of the regulars started to show up and
the sky started to clear. Bryan took off with the Puch and
Charlie followed him in the L-13. They reported lift and the sky
looked better and better with some cu's starting to form. Jim
finally got airborne about 1:45 P.M. He didn't return until 6
P.M. Robert Williams took off in the 1-26, I got into the
LegalEagle, and Bob Moore left in the Super Blanik. Dr. Frank
DeBianca took off later in the Russia. Bill Lawrence had 8
tows. Most flights were for more than an hour with the
experienced pilots averaging 3 hour flights. Monroe S. David
| Dr.Jack | Pilot Reports | |||
|---|---|---|---|---|
| Upward Velocity | 500 fpm | 400-500 fpm lift | ||
| BL Top | 4500 ft | 4500 ft high for the day - Jim H. | ||
| Critical Height | 3500-4500 ft | That was where most of us thermalled | ||
| BL Wind | 10 kt SW | About right |
Memphis, TENNESSEE - Apr. 2002
[This report of a bad forecast, and the significance of the height variability
prediction, is provided to balance out the highly successful
reports from the same site given below. From a report sent
to the Memphis Soaring Society mailinglist]
Both Dr. Jack and the soaring forecast out of Little Rock had the day
classified as a no-soaring day, but for the record:
| Dr.Jack | Pilot Reports | |||
|---|---|---|---|---|
| Upward Velocity | 200 fpm | 800 fpm | ||
| BL Top | 1500 ft | 4000 ft | ||
| Height Variability | 3500 ft | nice fudge factor Dr. Jack! | ||
| BL Wind | 5 kt SSW | OK |
Memphis, TENNESSEE - Apr. 2002
[Are there weather cynics everywhere? From a report sent to the Memphis Soaring Society mailinglist]
Got up this morning, turned the clocks forward one hour,
and sat down at
the iMac to find out what Dr. Jack is forecasting for today's soaring at
FCY.
It looked to me like the forecast was:
Updraft Velocity 400-600 fpm
Boundary Layer Top - 4500 to 5500 ft
Critical Height 3500 to 4500 ft
Height Variability +/- 1500 ft
Boundary Layer wind speed - 5-10 kt out of the South East.
Discussed this forecast at the SawMill Restaurant at 9:00 AM while
wolfing down an Arkansas breakfast. A lot of weather cynics around the
table. ...
It looked a little grim for Dr. Jack early in the afternoon, as there
were several sled rides.
However about 2 P.M. the fleet launched and didn't come back.
We had 26 tows.
Pilots encountered lift velocity of 400-to 500 fpm.
The highest altitude was 4920 ft by Trent Whitehead in the Grob.
The average altitude was 3500 to 3800 ft
The wind speed at altitude was 5-10 mph.
however, the wind was out of
the northeast to east, instead of the predicted southeast!!!
Close enough for horseshoes and hand grenades !!!
Dr. Jack is 4 out of 4 in my book.
Monroe S. David
[DrJack is occasionally a weather skeptic, but never a cynic.]
Memphis, TENNESSEE - Apr. 2002
[A successful forecast - from a report sent to the Memphis Soaring Society mailinglist]
Dr. Jack's BLIPMAP called for a boundary layer of 4500 ft, a
critical height of 3500 ft, and an upward velocity of 400 fpm.
No Way! ... Launched and punched off at 3000'. My
vario is going off like an alarm clock with thermals of 4 to 6
fpm. I get up to 3800 ft and start bouncing around between 3200 ft
and 3700 ft . Soon my hour is over, and I radio back to FCY to see
if anyone wants the Grob. Are you kidding! They are lined
up like sharks.
For the first time since Uvalde last summer, I have to pull spoilers
to get back to FCY.
For the day, we had nine tows, with the highest being 4,000 ft by Dick
Cadieux in the Grob.
It was a hell of a day, and Dr. Jack proved himself again.
OK Dr. Jack, give us a good forecast for this Saturday. We want to
fly in Arkansas!! Monroe S. David
Forrest City, ARKANSAS - Mar. 2002
[The first non-California report]
Dr. Jack, I have used your SouthCentral Blipmap for the past two
weeks in flying my 1-26 with the Memphis Soaring Society at Forrest
City, Arkansas. I find it to be very helpful and the predictions
have been very accurate. when when the BL Top is under 2500 ft and
updrafts of 200 fpm. I want to test the full range - get the BL
Top up to 8000 ft, the updraft velocity up to 600 fpm and the BL wind
speed down to 10 kts over east Arkansas on a week-end and I will.
Thanks and keep up the good work. Monroe S. David, LegalEagle
275
[DrJack sez that Monroe needs to come out to Nevada!]
Hollister, CALIFORNIA - Mar. 2002
[A report verifying a prediction of small-scale height differences]
Thanks again to Dr. Jack. His blipmap yesterday was right on the
money again. I was surprised to see that the max altitude forecast
for Hernandez area was significantly higher than Panoche - usually it
is only a couple of thousand feet higher, but today there was a
difference of 4000 ft. Yet while we struggled at 5K-6K all the
way to Hernandez, there we found a shear line marked with high base
cu's and got up to 10.5K. Ramy Yanetz
[While it is
gratifying that such small-scale forecasted differences can be
correct, users should not expect that to always be the case.
BTW, Ramy flies an LS4 sailplane]
Williams, CALIFORNIA - Mar. 2002
Milt Hare has written about his extensive first year
experiences using BLIPMAP in his
posting to rec.aviation.soaring.
Los Angeles, CALIFORNIA - Feb. 2002
[A long-term verification from a hang-glider pilot]
Hello Dr. Jack Crestline hang glider pilot Dan DeWeese
here. Have used the top of lift page for about 6 months
now. Great work. With the GSD [sounding] page I
have been able to nail almost every great soaring day this
winter. Thanks again for your contributions to the greatest
sport on earth!! Dan
Los Angeles, CALIFORNIA - Aug. 2001
[How a hang-glider pilot utilizes BLIPMAPs with other weather predictions]
Hi Dr. Jack,
As for how I use the blipmaps -- I primarily use them to pick the best
place to launch my hangglider from. Secondarily, I use it for advice on
which direction to fly, but primarily it helps me choose which site I think
has the most potential for a given day. For a regular weekend day out
soaring, I do not mind driving up to approx. 100 miles to get to the best
site. The thermal height and velocity pages are my primary interest for
this, but I am also watching the boundary layer convergence map, as Lake
Elsinore is known for fantastic convergences. I will be comparing your
maps against my actual experiences when I can, especially regarding the
'Elsinore Shear'.
I don't know if this info is useful to you, but here is a quick rundown of
the other weather resources I use. I start by checking the NWS forecasts
for the local mountains, usually LA, Ventura, and San Bernardino counties.
Sometimes I also check Santa Barbara and San Diego counties as well. Then
I read the NWS Area Forecast Discussion memos put out by both LA/Oxnard and
the San Diego offices. Sometimes I also check the Owens Valley forecast,
and the Las Vegas office area forecast discussion, if I am looking at
heading up to the Owens. I will check the BLIPMAPS either just before, or
just after I do this. Then I will also check the southern california winds
and temperatures aloft forecast. I will also check the 700 MB AVN model
forecast map on Unisys. Finally, I also will look at the 'forecast
soundings' provided by the NOAA Forecast Systems Laboratory. Sometimes, I
will have pretty much figured out where to fly just from the Blipmaps and
the NWS Area Forecast Discussions (and forecasts). Other times, I use all
the data I can get to make the best choice.
The Blipmaps are the one piece of weather data that is designed for soaring
use, so it fits my needs the best of all my resources. But of course, I am
still trying to compare real world results to the forecast data, so for
that and other reasons, I feel compelled to gather as much info as I can.
Thanks,
Mike Miller
Link to the Regional BLIPMAP page
Link to DrJack's home page