TRACK-AVERAGE SOARING FORECASTS
with
"OPTIMAL FLIGHT" GROUND SPEED AND TIME
Updated: Sept 9, 2008
OVERVIEW
This program evaluates the importance of thermals and winds along an
entire glider flight path, rather than at a single point, by averaging
BLIPMAP forecasts of thermal strength and wind along each leg of a
flight track defined by user-specified turnpoints.
In addition, wind-adjusted "speed-to-fly" theory for a user-specified
glider polar is used to compute "optimal flight" times, speeds, and
expected thermalling percentages along the route - this can prove
useful for flight planning, though it ignores many factors which can
significantly affect actual soaring flights (see caveats below);
The program described here and this webpage are both experimental and
under development. My main intent at this point is to determine
the usefulness of such calculations in actual practice. Changes
and updates are expected. Bugs, problems, omissions, reports
favorable or otherwise, & etc. should be reported to the Blipmap Forum.
GENERAL NOTES
These predictions are of course dependent upon the accuracy of the
meteorological forecasts! Thus they should be examined
critically and evaluated using one's knowledge of forecast model
limitations. Model forecasts are inherently noisy - not every
wiggle can be believed! Relative comparisons will be more
accurate and useful than the specific numbers provided.
An advantage to these forecasts is that they are tailored to a
specific area and path. Possibly their most useful feature is to
provide single numbers, such as the spatial average climb rate or the
"optimal flight" flight time, to evaluate conditions over a specified
area.
Comparison between different models, RAP and NAM, for the same path
can be used to evaluate the uncertainty in the day's predictions (such
comparison can easily be made for a prescribed flight track by
creating two different Bookmarks, one using NAM forecasts and the
other RAP - see the "Bookmark" section below).
The current computations do not allow for the variation of conditions
with time. Such could be added (for RAP forecasts in
particular), but I first want to evaluate the usefulness of the
present tool before considering adding more complexity, which might
not actually make the computations significantly more useful.
I urge any user of these "Track Average" forecasts to simultaneously
view the Thermal Updraft and BL Wind BLIPMAPs upon which they are
based! BLIPMAP graphics have the advantage of utilizing the
mind's powerful pattern analysis capability to better evaluate a
complex forecast, such as the spatial "noisiness" of the
meteorological forecasts or possible advantages to deviations from a
perfectly straight flight path.
"OPTIMAL FLIGHT" NOTES
The accuracy of the "optimal flight" results depends upon the many
assumptions made by "speed-to-fly" theory, which can be overly
simplistic (though the foremost factor affecting accuracy is, of
course, often the accuracy of the meteorological
forecasts! ) "Speed-to-fly" theory assumes that a flight
consists entirely of simple circling climbs in thermals followed by
optimal speed glides to the next thermal (and thus omits the initial
tow and final glide). Note that the only forecast parameters
used are thermal strength and wind speed+direction - there is no
dependence upon thermal depth or terrain or clouds (or anything else).
Limitations of this approach include:
-
Actual flights often use lines of uplift created by ridge lift,
convergences, thermals following ridgelines, & etc.
"Speed-to-fly" ignores all such lift.
-
Existence of clouds can greatly expedite forward progress, both by
marking thermals and by augmenting their strength (release of latent
heat). "Speed-to-fly" ignores clouds.
-
Deeper thermals allow faster speeds, all else being equal.
"Speed-to-fly" ignores thermal depth.
-
Unfavorable conditions at only a single grid cell can block
forward progress, rendering the entire leg "impassible"
mathematically (see below). In reality such a problematic region
might be traversed by a long glide or by circumvention, but
"speed-to-fly" does not allow such possibilities.
-
Initial tow and final glide are neglected.
-
"Speed-to-fly" calculations do not allow for lateral deviations from
the straight-line track to follow areas of stronger lift.
Thus these predictions should be examined critically and evaluated
using one's knowledge of factors not included in these simplistic
calculations (including forecast model limitations). Again,
relative comparisons will be more accurate and useful than the
specific numbers provided. BTW, interpretation is greatly
enhanced if one also views the Thermal Updraft and BL Wind BLIPMAPs
upon which the optimal forecasts are based!
Note that an optimal flight solution does not always exist for a
leg ! If the forecast thermal strength is not large enough
to keep the glider aloft or to allow forward progress for the given
wind conditions at a single grid cell along the leg, then no
optimal flight exists for that entire leg. In such a case
dashes will be displayed in the columns giving optimal flight results
for that leg (and for the total). Note that while unfavorable
thermal/wind conditions at only a single grid cell can render the
entire leg unfeasible mathematically, in actuality the flight may
often be possible. In reality such a problem area might actually
be passible, through a long glide or circumvention for example,
particularly if the path through that grid cell is shorter than a full
grid width - but the simple mathematical assumptions used do not allow
that possibility. The along-track plot will indicate the location of
such problematic conditions, as the optimal ground speed will be 0 and
the thermalling percentage 100%.
If you wish, the optimal flight forecasts can be altered or "tuned" by
changing the tmult input parameter, which multiplies the
predicted "Thermal Updraft Velocity" values. Ideally that factor
would be 1, but the method of predicting thermal velocity has some
slop in it due to questions about the applicable averaging time so in
fact the "best" theoretical value may not be precisely 1.
However, determining a true "best" value would not be a simple task
since it would require excluding all factors which can bias the
results - one would need a day on which meteorological predictions
proved reasonably accurate with many flights which approximate the
simple "speed-to-fly" model being flown by skilled pilots.
Simply altering the predicted optimal flight time using this factor
assumes that any error in the optimal flight prediction results from
thermal strength forecast errors, which may not be the case! You
may find a value differing from 1 which better predicts enroute flight
times, but that does not mean that that number is applicable to
everyone and all circumstances.
While the optimal flight numerical values can be used flight planning,
this is useful only when its simplistic assumptions reasonably match
the actual gliding situation, as when simply moving from one thermal
to the next over flat terrain directly toward a goal. I have
strong doubts about the exactness of the precise numerical
values, given the methods simplicities plus the inaccuracies and
uncertainties inherent in meteorological modelling. And in
addition there are pilot variations - everyone knows that two
different people can have two quite different times over the same
track on the same day! My expectation is that these forecasts
will be most useful in indicating relative differences between
days over a given area, not for telling exactly how long it will take
you to fly a given route! Still, I don't fly in flat terrain
where this theory is most applicable so am not in a position to truly
evaluate it - that I must leave to others.
I would be interested in hearing of any useful comparisons
between the optimal flight forecasts and actual flights. By
useful I mean results which provide scientifically appropriate
comparisons, that is: (1) omit flights which do not roughly
match the simple "speed-to-fly" model (e.g. not over flat terrain),
(2) omit days on which there were obvious failures of the
meteorological forecasts (e.g. an unforecast intrusion of high-level
clouds), (3) cover multiple days (to average out the inherent
"noisiness" of any single day/flight). Ideally they would even
be for more than one pilot!
PROGRAM OUTPUT AND INTERPRETATION
Sample output for the "Bookmark" example given below is (but
results shown here differ from those obtained if you run
that example, since you are obtaining results for a different day)
            FLIGHT TRACK AVERAGES
 --------------------------------------------
 ("optimal" uses wind-adjusted speed-to-fly)
     Valid:  NAM  TUE 15 Aug 2006  21z
     PolarInfo:  LS-3 (L/D=40)
     WeightRatio:  1   DryWeight:  383 kg
     ThermallingSinkrate:  1 m/s
     CANV Lat,Lons:  39.00 -117.00
                     41.00 -116.00
                     39.00 -117.00
 --------------------------------------------
 L   -Spatial-Avg- ----Optimal-Flight-Avg----
 E       Tail Clmb Tail Clmb      Gnd Air Thm
 G  Dist Wind Rate Wind Rate Time Spd Spd Pct
      km   kt  m/s   kt  m/s  min  kt  kt   %
 1   247   13  2.0   12  1.9  140  57  78  26
 2   247  -13  2.0  -13  1.9  190  42  83  49
TOT  494    0  2.0   -2  1.9  330  49  81  40
The text summary indicates that for NAM model forecasts for the
current day at 21z, the simple spatial average along the specified
route (an out-and-return) is for a climb rate (Thermal Updraft Velocity
minus Thermalling Sinkrate) of 2.0 m/s. An optimal flight by a
LS-3 would experience an average climb rate of 1.9 m/s on both legs,
indicating less time spent in regions of stronger updraft. The
outbound leg has a tailwind, on average, which becomes a headwind on
return. The distance of each leg is shown with the time, ground
speed, air speed, and percentage of time spent thermalling for each
leg. On the tailwind leg, a lower airspeed when gliding is
required for optimal flight, yet the actual ground speed is higher and
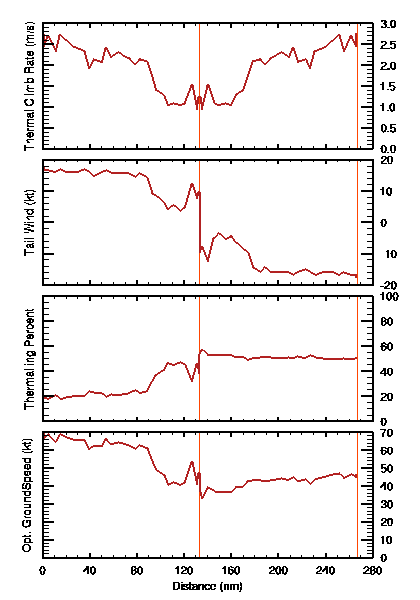
less time will need to be spent thermalling. The plots indicate
how conditions vary along each leg - though these details need to be
taken with a grain of salt, realizing that predictions at a single
grid point, as these are based upon, can be very noisy! For this
case, they show that forecast variations of thermal strength and
tailwind result in thermalling percentage and optimal groundspeed
varying significantly along the outbound leg. Note that if
conditions at one grid point produce a groundspeed of 0 and
thermalling percentage of 100%, the leg as a whole has no optimal
solution!
Interpretation Notes:
-
A leg average tailwind of zero, or close to it, does not mean that the
wind is near-zero over the entire leg! I once puzzled over why I
was getting different results for the two legs of an "out-and-back"
track with zero average tailwind, only to discover upon detailed
examination that there was in fact a wind which reversed direction
near mid-leg - while those canceled in the spatial average for each
leg, they produced different optimal velocities for each since the
thermal velocities varied significantly along the leg so weak thermal
velocities were associated with a head component for one leg but with
a tail wind segment of the return leg, acting as a "chokepoint" which
made the latter a more difficult leg.
-
When headwinds are strong enough to greatly reduce ground speeds, a small change
in wind speed or thermal strength can produce a large change in the optimal
ground speed and leg travel time.
-
I'd like to emphasize that unfavorable conditions at only a
single grid point can block progress along a leg when using
"speed-to-fly" assumptions, rendering the entire leg
"impassible" mathematically. For example, one track out of
Truckee CA gave "no solution" even though the track's spatial climb
rate was 2.8 m/s with no wind, on average. Detailed examination
found that the Truckee point was affected by adjacent Lake Tahoe
which, as a water surface, squelched lift and made that grid point
impassible mathematically even though the rest of the route had quite
favorable conditions.
-
In a case such as the previous one, where the launch/land location experiences
relatively unfavorable conditions, a more realistic solution can be
obtained by starting the track from the release-from-tow location and
ending it at the point where final glider commences. This is
necessary to compensate for the fact that the simple speed-to-fly
assumptions used here do not consider initial tow or final glide, can
allow the pilot to be relatively unaffected by poor soaring conditions
close to the airport.
-
Note that "optimal flight" results are
flight averages so their thermal and wind magnitudes are
weighted more heavily by regions where the ground speed is smaller (as
will occur with weak thermals or a headwind) just as on an actual
flight.
RUNNING THE PROGRAM
The program can be run in two ways:
(1) Interactively, using the regional viewers:
A flight track is selected using mouse clicks on a forecast map
displayed in a regional
viewer with user selection of glider-specific data, after which a
popup window displays the corresponding optimal flight time and speed
and average meteorological conditions. To use this viewer
feature (as also documented in the viewer's own popup instructions),
-
First load a (non-composite) forecast page. [Note that the
browser must have valid DrJack cookie for access.] A good choice is
the "Thermal Updraft Velocity" since the optimal flight time depends
mainly on that parameter. But any non-composite map can be used
since the map is only used to set the flight track turnpoints.
-
Click on Toggle "Calc TrackAvg" to display the track averaging
input selectors.
-
Activate (check) the "Add to FliteAvg Lat,Lons" Popup checkbox so that
mouse clicks on the image will be saved as latitude/longitude points.
You may wish to un-check the other Popup checkboxes to disable those
Popups.
-
Click on the screen at the location of your desired first track
point. Then repeat for other points along the track. Note
that the small window displays the number of points in your selected
track as you progress. Once added, individual points cannot be
deleted - you must instead clear all the points using the "Clear
LatLons" button.
-
Select the desired glider Polar.
-
Select a "ThermallingSinkrate", which is your estimate of the glider
sink rate when thermalling.
-
Additional optional choices are selection of a ballasted glider (for
certain gliders), and a multiplier of the forecast thermal
strengths. See the "Program Parameters" section below for further information these choices.
-
Click on "Calc FliteAvg" button to display a popup window containing
the computed Optimal Time and Speed for that flight track and the
average meteorological conditions along the track.
-
For a new calculation, you can alter one of your existing settings and
re-click the "Calc FliteAvg" button. Note that prior to selecting a
new path you must click the "Clear LatLons" button.
-
Note that you can click on "Save Setup" button to save your settings (except for
the flight path) between sessions.
(2) Using a browser URL or Bookmark:
Flight track and glider-specific data can be specified in a browser
URL, with output being displayed in the browser. Since the required
URL is a long one, it is usually most convenient to store a specific
path as a bookmark, which when loaded into the browser will display
the optimal flight time and speed and average meteorological
conditions for that path based on the latest model forecast
data. Alternatively, browser-mimicking software can be used to
send the desired URL and receive the output.
-
Creating a URL with Specified Track and Gilder Information
In your browser's "location" (URL) box, input a following line ala the following but with CAPITAL words replaced by the
desired parameter value, as described in the detailed information below : [FYI, the parameter order
is optional and those parameters colored green are optional, as described in the "Program Parameters" section below.]
http://www.drjack.info/cgi-bin/get_bliptrackavg.cgi?latlons=LATLONS®ion=REGION&model=MODEL&day=DAY&time=TIME&polar=POLAR&wgt=WGT&tsink=TSINK&tmult=TMULT
An example for a 3-point, 2-leg track is (note that its output changes when current forecasts change!)
http://www.drjack.info/cgi-bin/get_bliptrackavg.cgi?latlons=39.00,-117.00,41.00,-116.00,39.00,-117.00®ion=CANV&model=NAM&day=0&time=21&polar=LS-3&wgt=1&tsink=1&tmult=1
-
Storing a Bookmark
It's easy to make mistakes in such a long URL. So it is often
best to save it as a Bookmark - then you only have to create the
needed URL once for a given path and glider and forecast
model/time ! Test what you've input to make sure it works (for
RAP this must be done when current day data is available), ensuring
the numbers in the output header lines is correct. When it is
satisfactory, save that URL as a browser Bookmark. If you create
several, give each Bookmark a distinctive name so you will be reminded
what it is for.
-
Using a Bookmark for Current Forecast Conditions
The next time you use to that Bookmark it will use the specified track
and glider data for the current forecast conditions of thermals
and wind of the desired model and time. So you can use it to
quickly determine how "good " a day is for that selected path.
Different bookmarks can be created for many different purposes.
For example, bookmarks identical except for differing paths can be
used to evaluation different flight directions. Or two bookmarks
set up to call the RAP and the NAM model but otherwise identical can
be used to evaluated the consistency of the forecasts for that
day. [Note that the browser have a valid DrJack cookie,
otherwise cookieless
access methods can be used.]
-
URL Parameters
The following parameter information is used when using a URL to produce Track Average predictions. Note that
the URL should contain no blanks and no quotation marks.
The order of the arguments is optional, so long as the first is preceded by a "?" and the others by a "&".
-
latlons
A sequence of Latitude,Longitude pairs in decimal
degrees and separated by commas, e.g.
39.00,-117.00,41.00,-116.00,39.00,-117.00 The
track must be entirely contained within the chosen region's
perimeter. A comma may be optionally included after the last
value. Note that a "West" longitude must be a negative
value.
-
model
Forecast model, i.e. NAM or RAP
-
region
Forecast region within which the track is located - i.e. CANV, NW, SW, GP, OKTX, NC, SC, NE, or SE
-
day
Forecast validation day.
For "currently available" data, this is an integer: 0 =CurrentDay 1 =Current+1(NAM only) 2 =Current+2(NAM only) -1 =PreviousDay.
For archived data, this is the desired date in format "YYYY-MM-DD" where YYYY =Year(4digits), MM =Month(2digits), DD =Day(2digits)
[Note that not all times may be archived and that archived datafiles are not available prior to June 1, 2006]
-
time
Forecast validation time (GMT). Must be an hour forecast by the selected model, e.g. 3Z or 18Z (the Z is optional)
-
polar
Glider polar information. Two different input format are available:
(1) Glider polar from pre-loaded data is available for gliders listed in the Appendix below - to use
that data simply use the listed name, e.g. LS-3
(2) Arbitrary polar data can be input in form a,b,c where a, b, and c are polar parameters
from the glider polar approximation W=a*V^2+b*V+c (such that a V in
km/hr will produce a negative W in m/s) - e.g
-0.000285925,0.067384,-4.828
[Note that when such
coefficients are obtained by fitting a polar to a low-order
polynomial, as used here, the speeds below the "best glide" speed are
usually ignored since inter-thermal speeds are typically larger than
that speed so inclusion of lower speeds would reduce fit accuracy at
the higher speeds.]
-
wgt (optional)
Glider weight information, which alters the glider wing loading. This number multiplies the wing loading assumed
by the existing glider polar coefficient data. However, the special value -1 uses the fully ballasted weight
from pre-stored glider data. If omitted, a default value of 1 is used.
-
tsink (optional)
Glider sink rate while thermalling (m/s). Depends upon the glider, bank angle, thermalling technique, etc.
If omitted, a default value of 1.0 m/s is used.
-
tmult (optional)
Multiplier for Thermal Updraft Velocity forecast. Can be used the "fudge" the results if desired, but normally this is set to 1. If omitted, a default value of 1 is used.
APPENDIX
Available Pre-Loaded Glider Polar Data
The following polar names can be input to utilize pre-loaded
Polar and Ballast information (based on WinPilot Carl Herold
data):
--1-Person-Sailplanes--
1-26A
1-26E
1-34
1-35A
1-36_Sprite
604
ASW-12
ASW-15
ASW-17
ASW-19
ASW-20
ASW-24
ASW-27_Wnglts
DG-400_15m
DG-400_17m
DG-800_15m
DG-800_18m
DiscusA
GenesisII
H-201_StdLibelle
H-301_Libelle
IS-29D2_Lark
Jantar2_SZD-42A
Ka-6CR
L-33_Solo
LS-1C
LS-3
LS-4a
Nimbus2_20m
Nimbus3_25m
Nimbus3T
Nimbus4_26m
PIK-20B
PIK-20D
PIK-20E
PIK-30M
PW-5_Smyk
RussiaAC-4_13m
StdCirrus
SZD-55-1
VentusA/B_17m
VentusB_15m
ZuniII
--2-Person-Sailplanes--
ASH-25_25m_Pil
ASH-25_25m_Pas
ASH-25M_Pil
ASH-25M_Pas
DG-500_Pil
DG-500_Pas
DG-500M_Pil
DG-500M_Pas
DuoDiscus_Pil
DuoDiscus_Pas
Grob103_TwinII_Pil
Grob103_TwinII_Pas
JanusB_18m_Pil
JanusB_18m_Pas
Nimbus3D_25m_Pil
Nimbus3D_25m_Pas
Nimbus3DM_25m_Pil
Nimbus3DM_25m_Pas
Nimbus4DM_26m_Pil
Nimbus4DM_26m_Pas
Nimbus4D_Pil
Nimbus4D_Pas
StemmeS10_Pil
StemmeS10_Pas