| How much does the NAM forecast one and two days in advance ("current+1" and "current+2" days) differ from what is actually predicted on the final ("current") day ? |
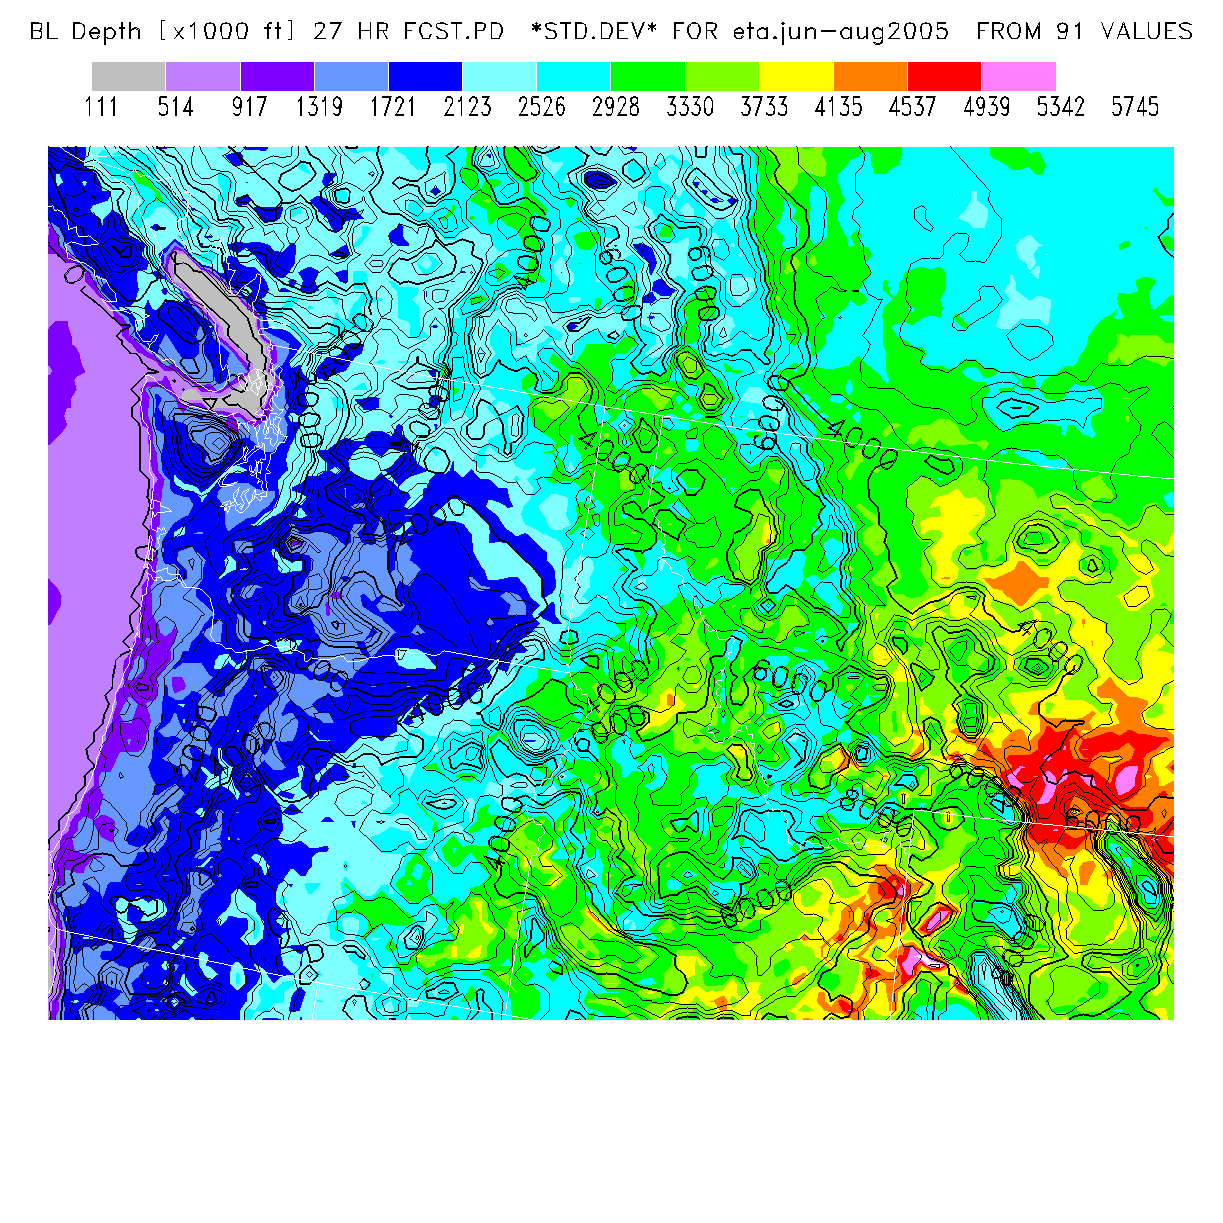
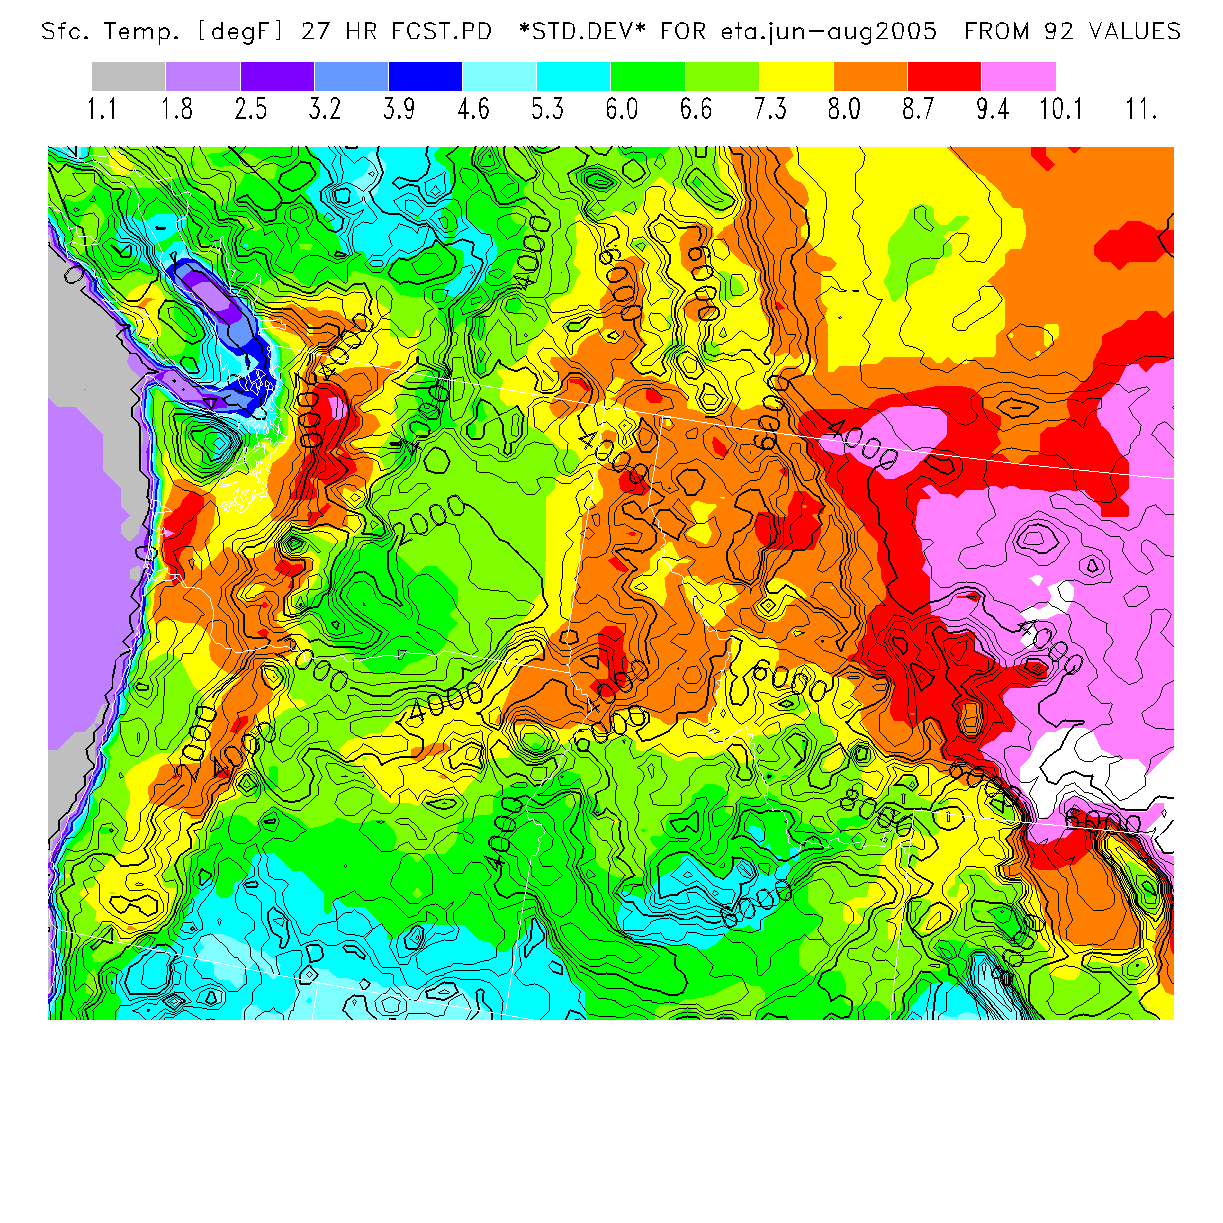
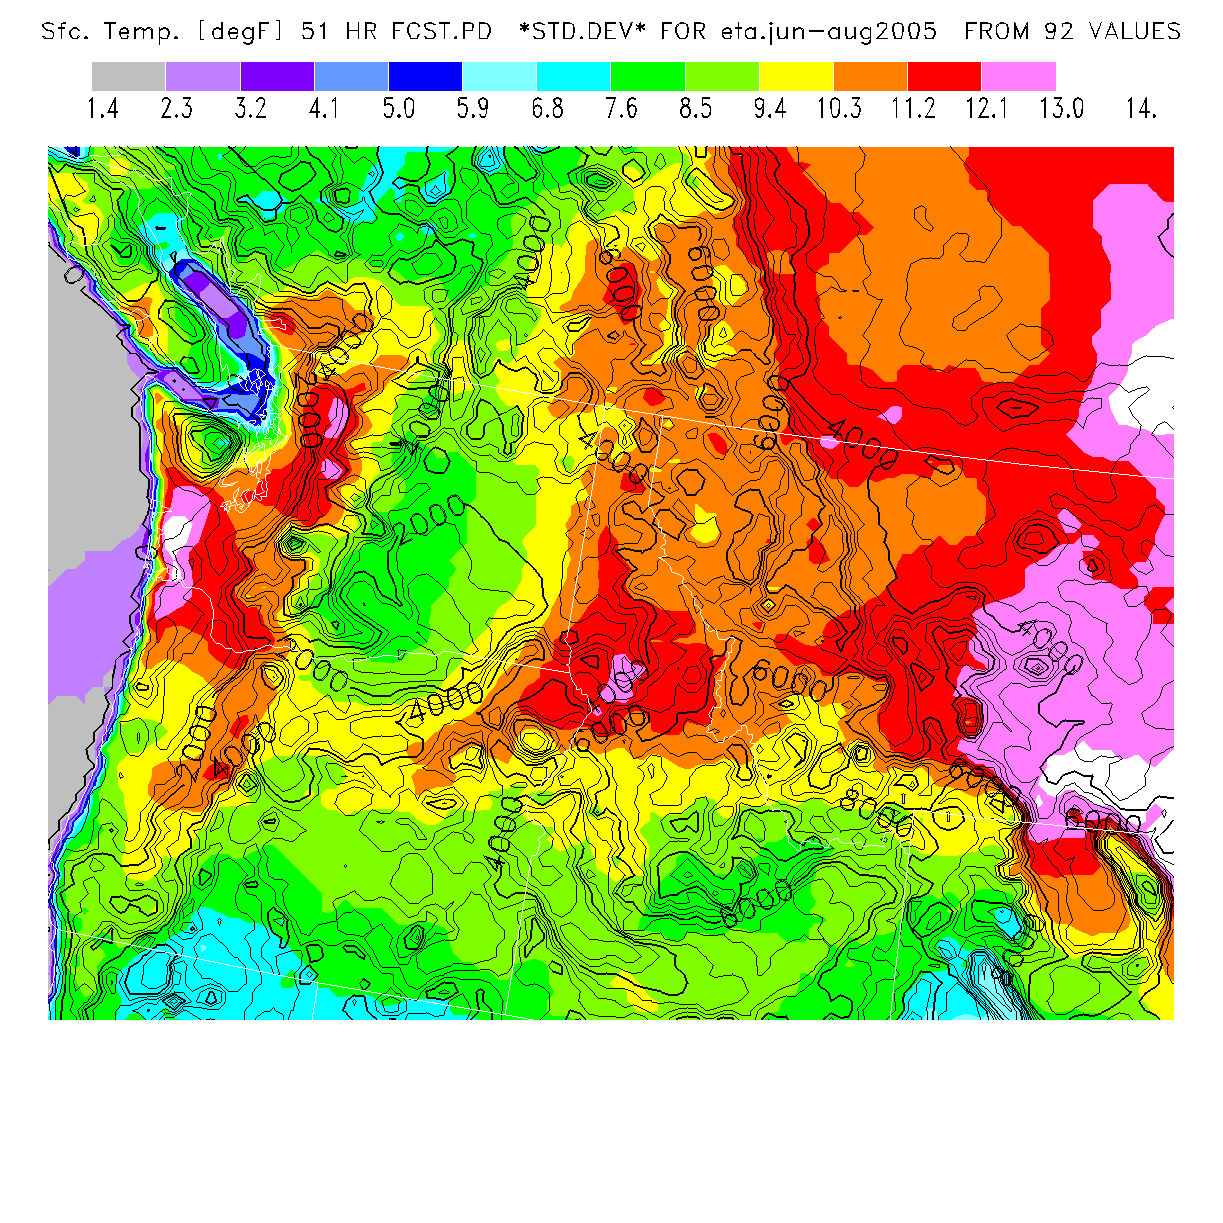
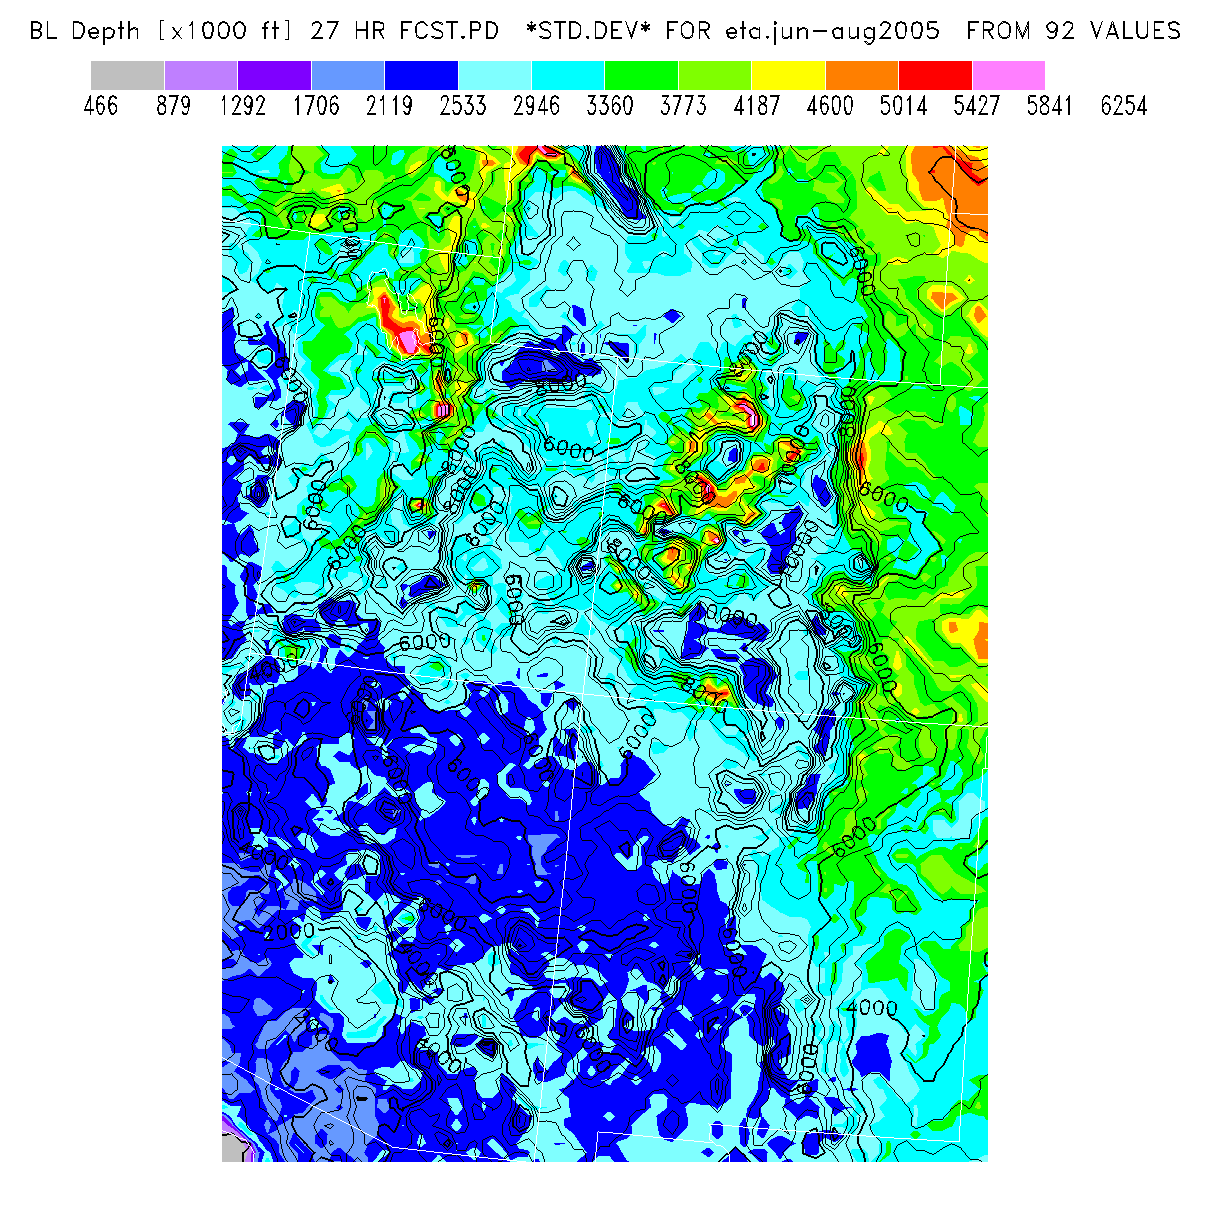
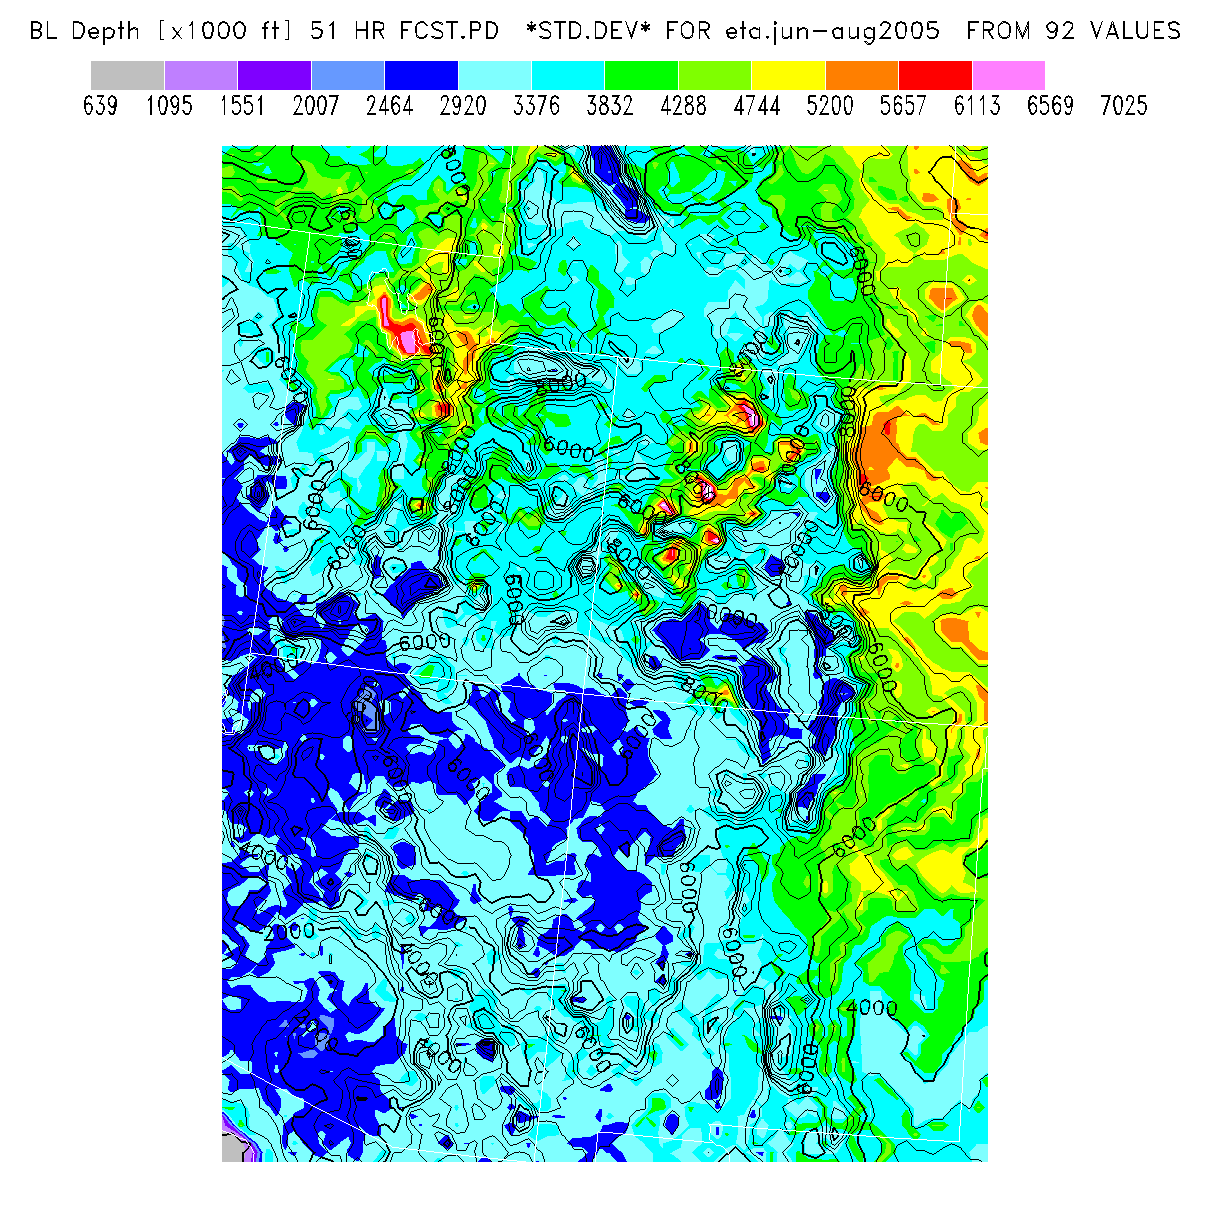
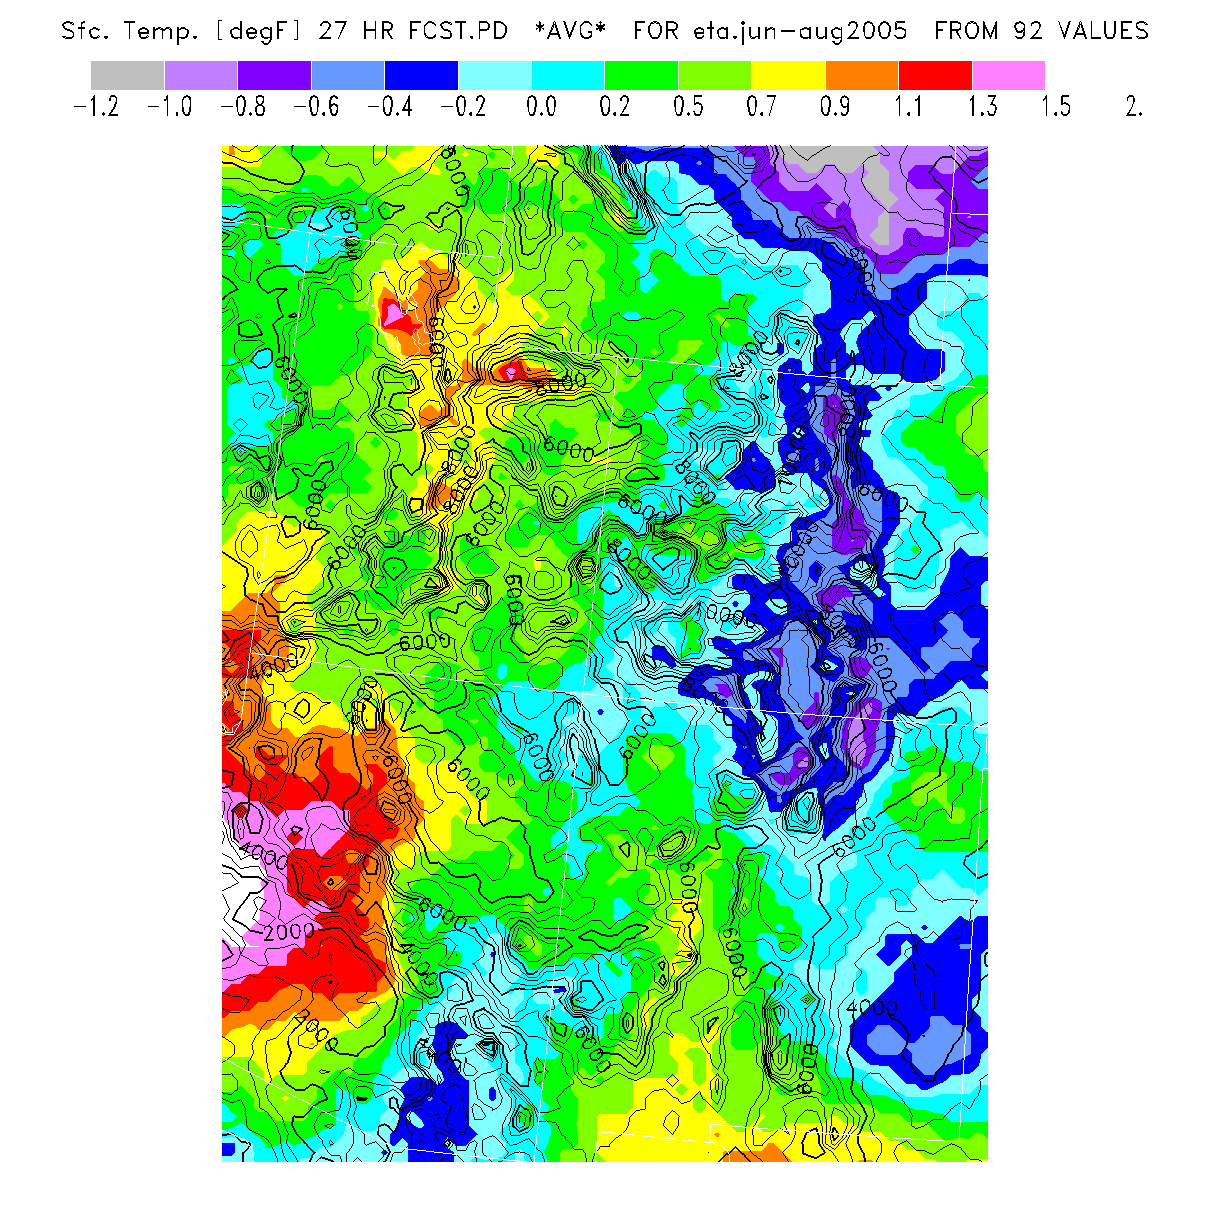
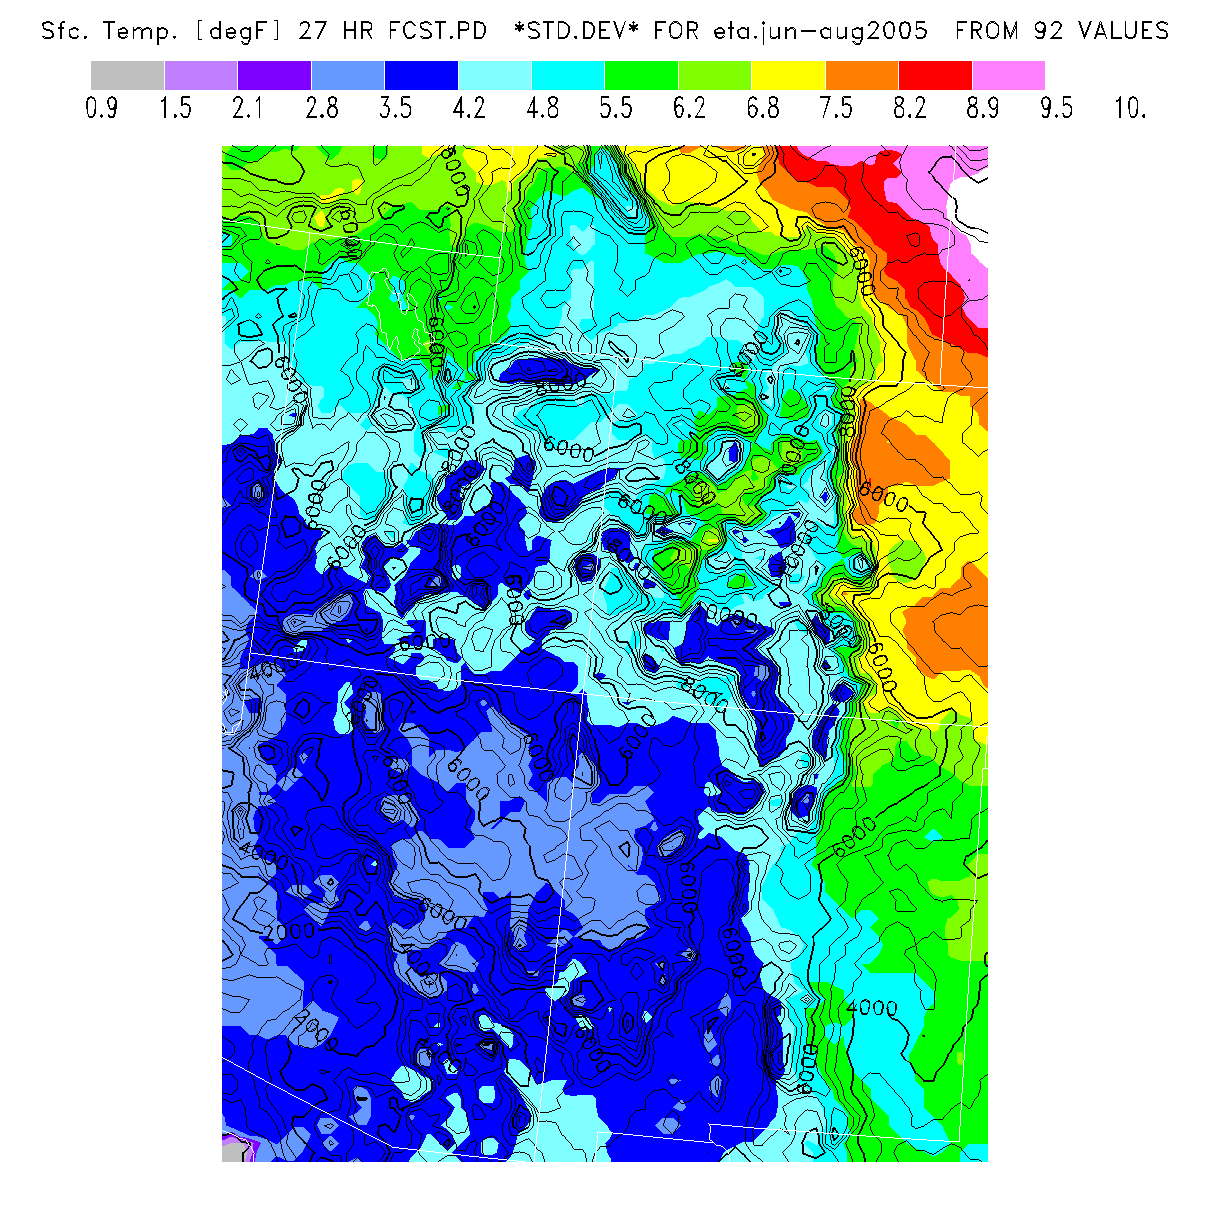
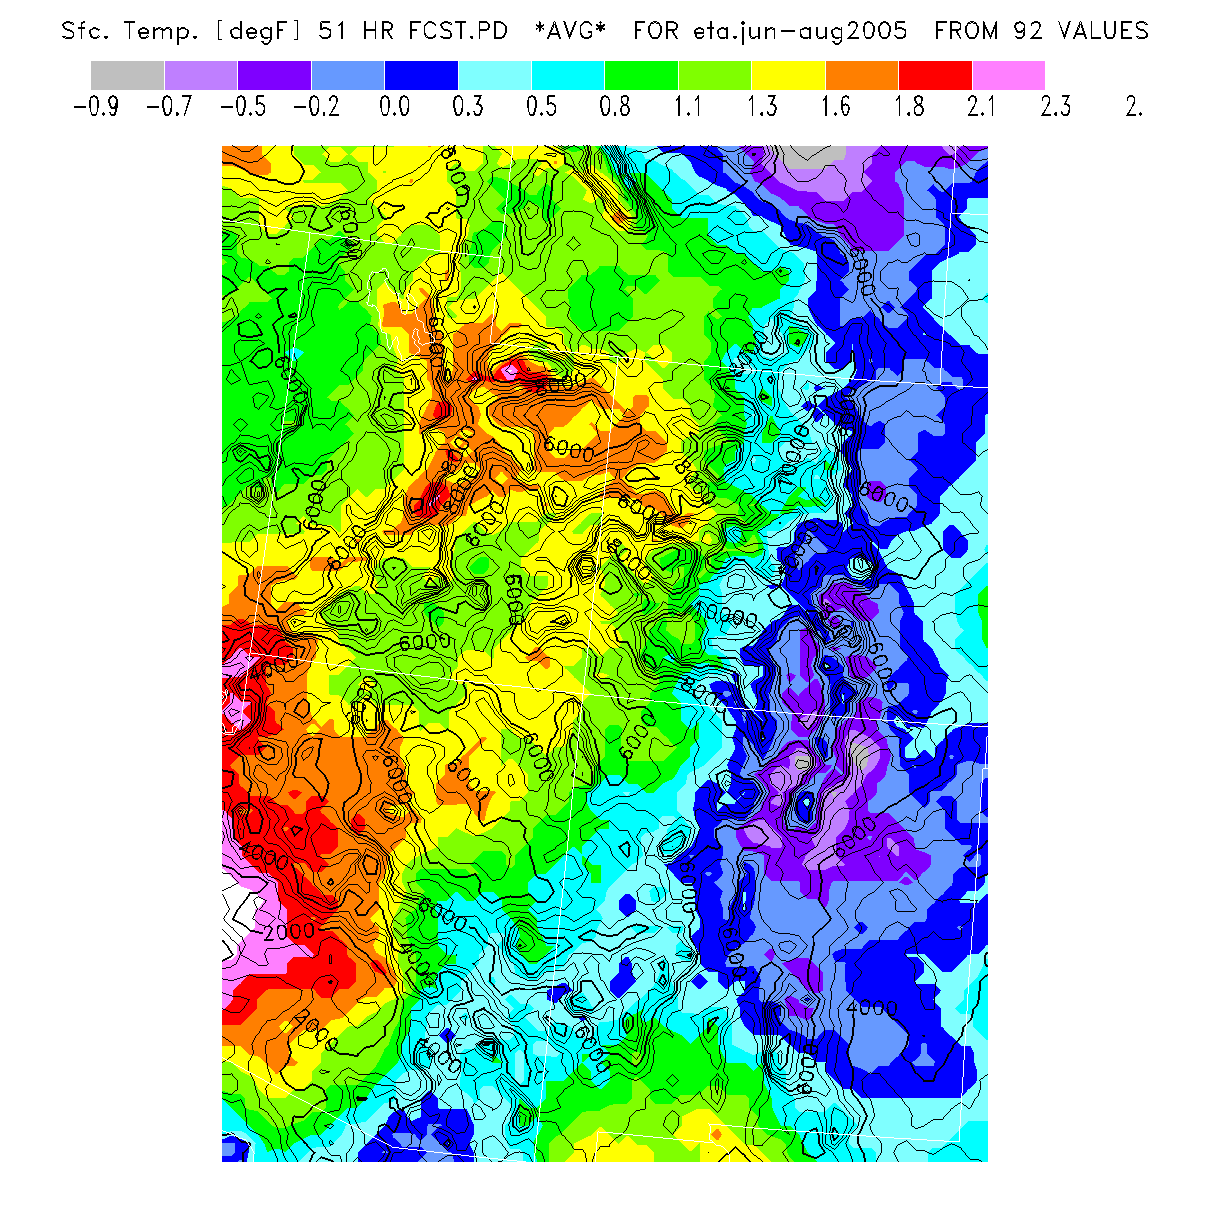
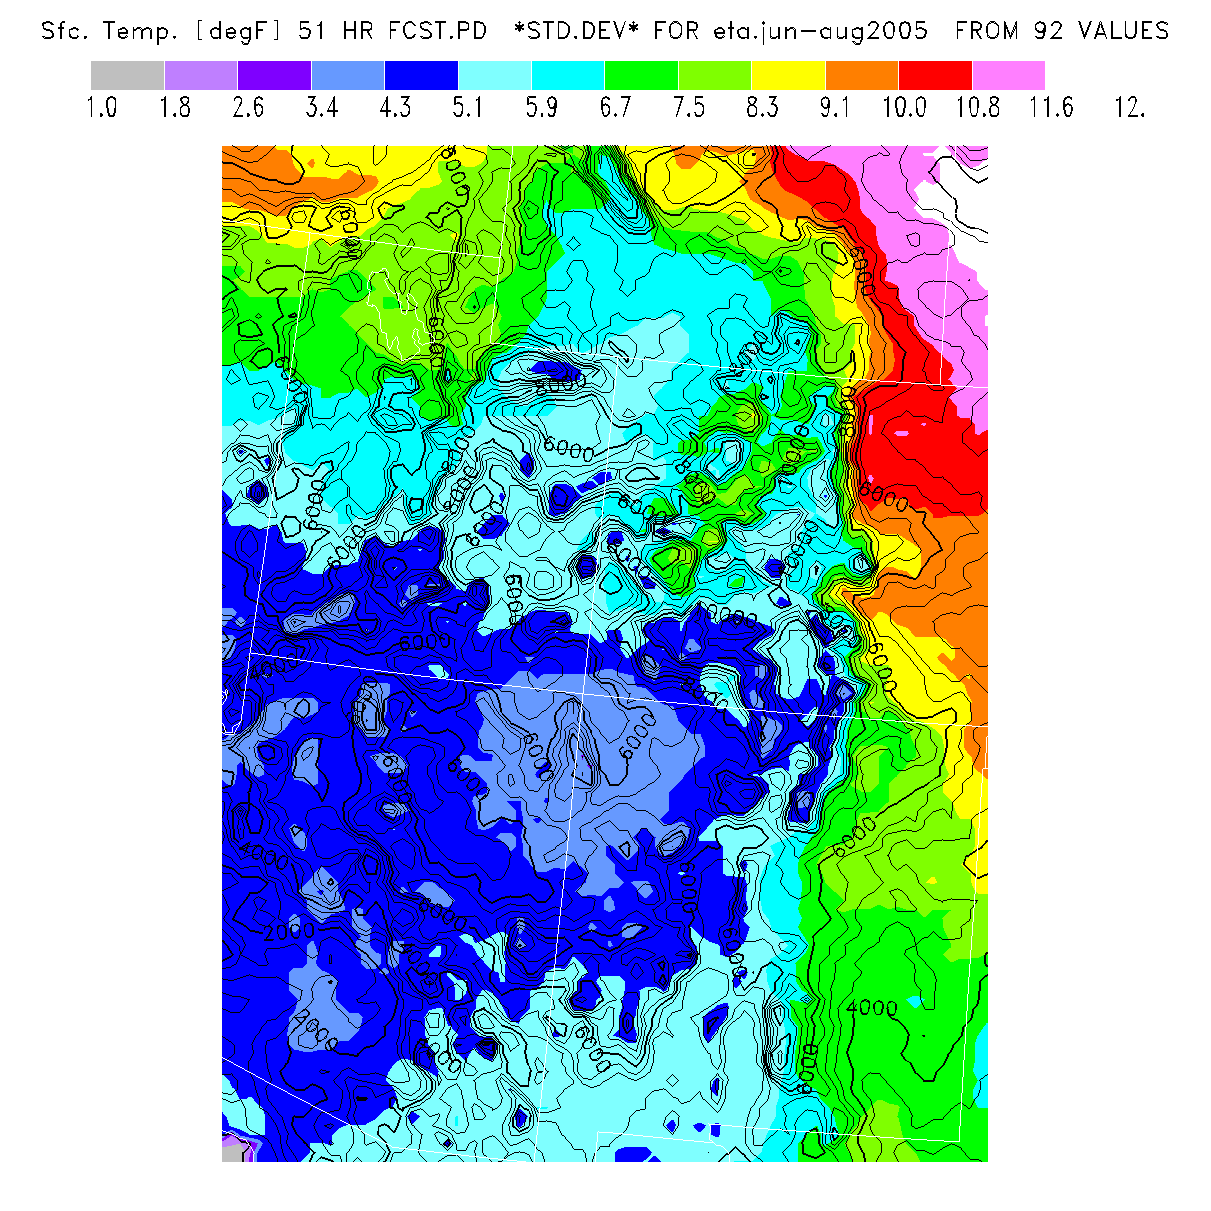
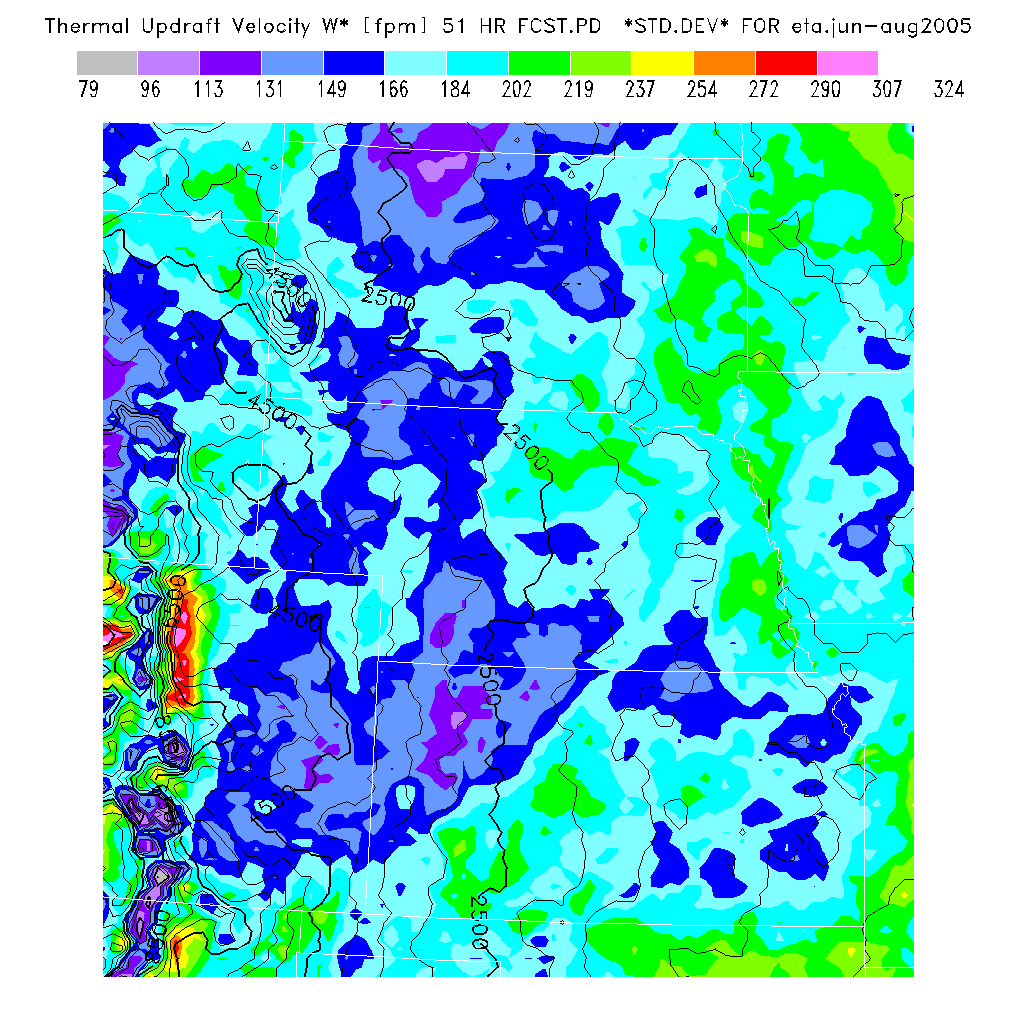
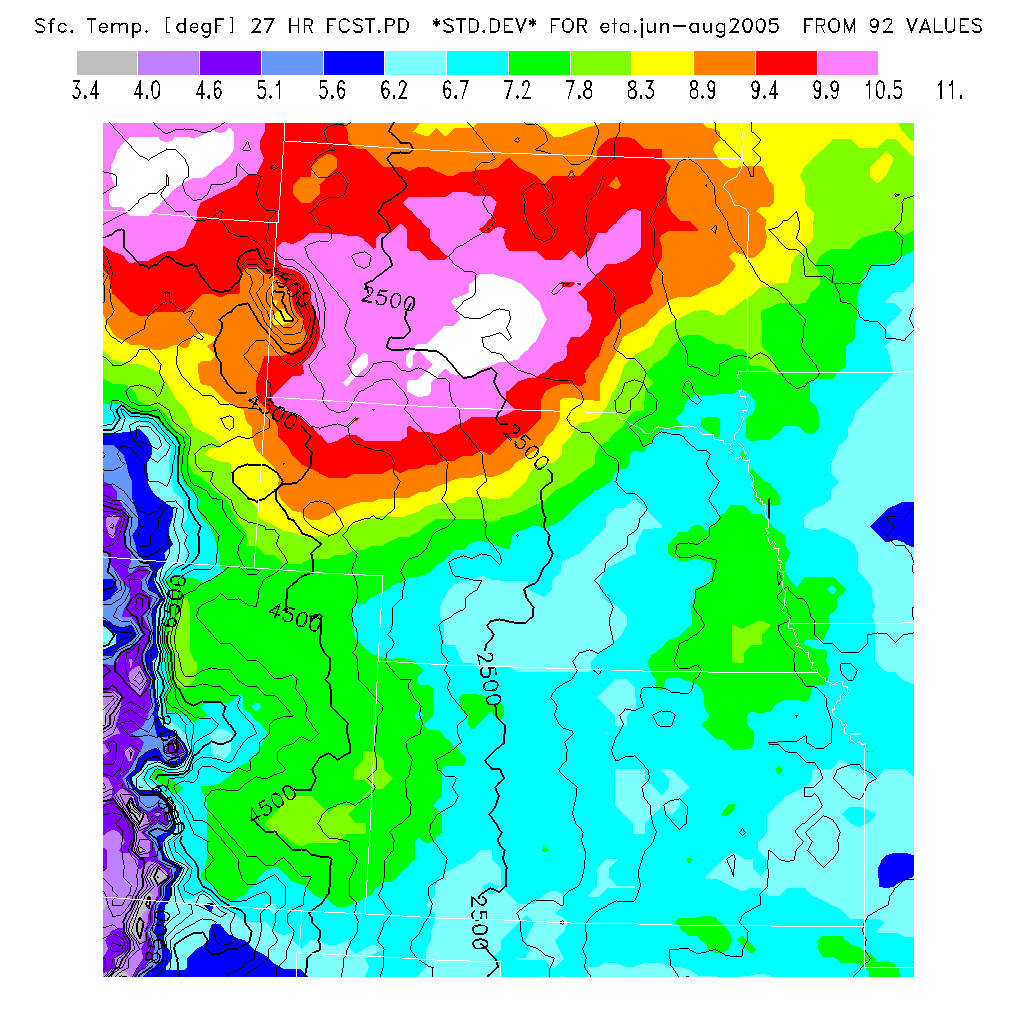
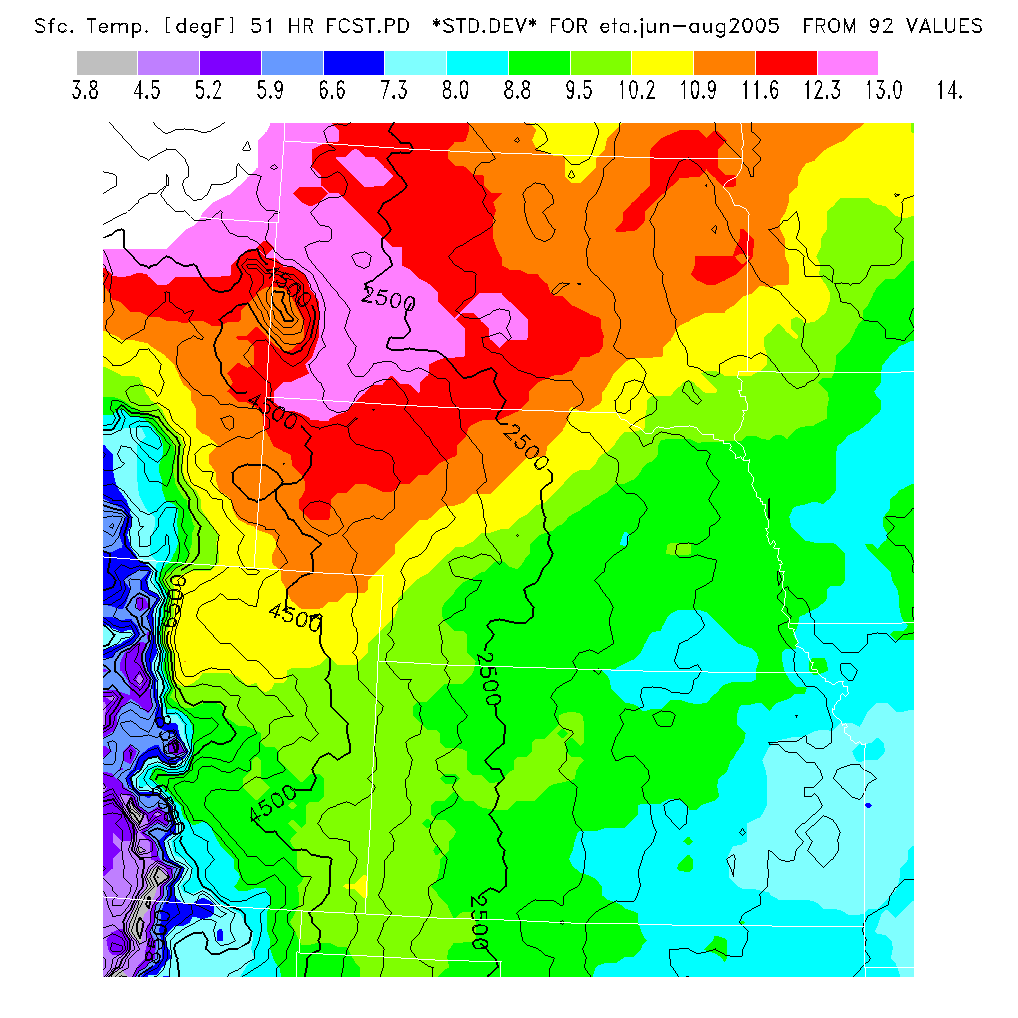
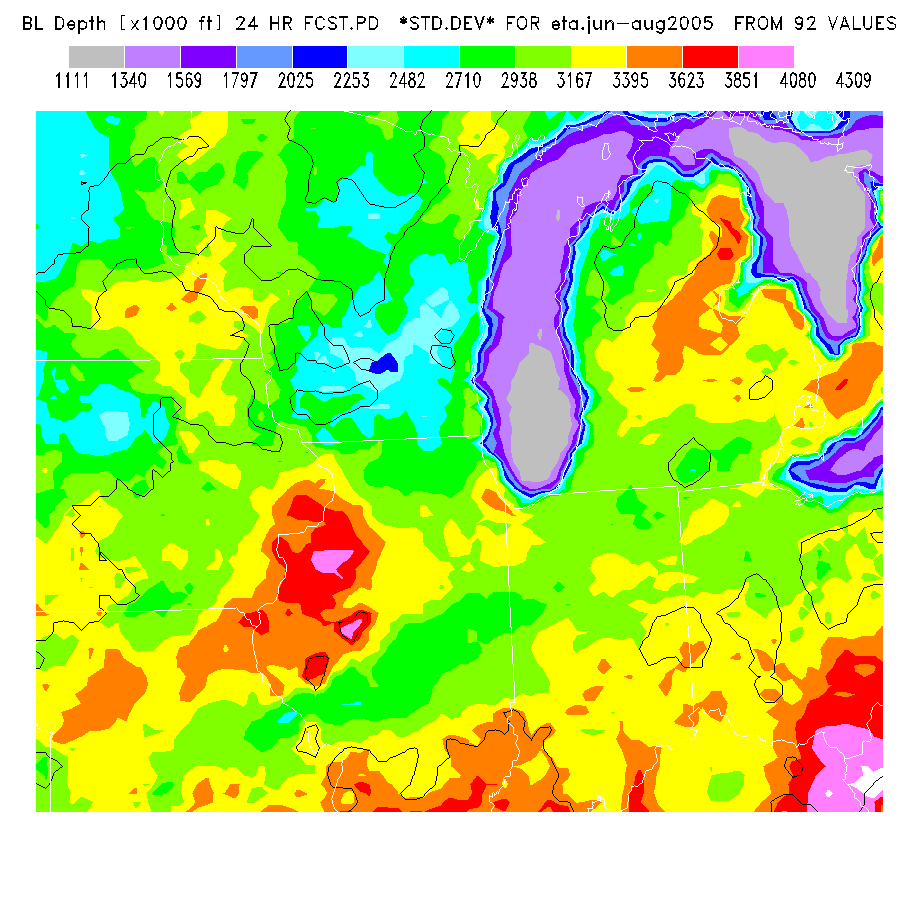
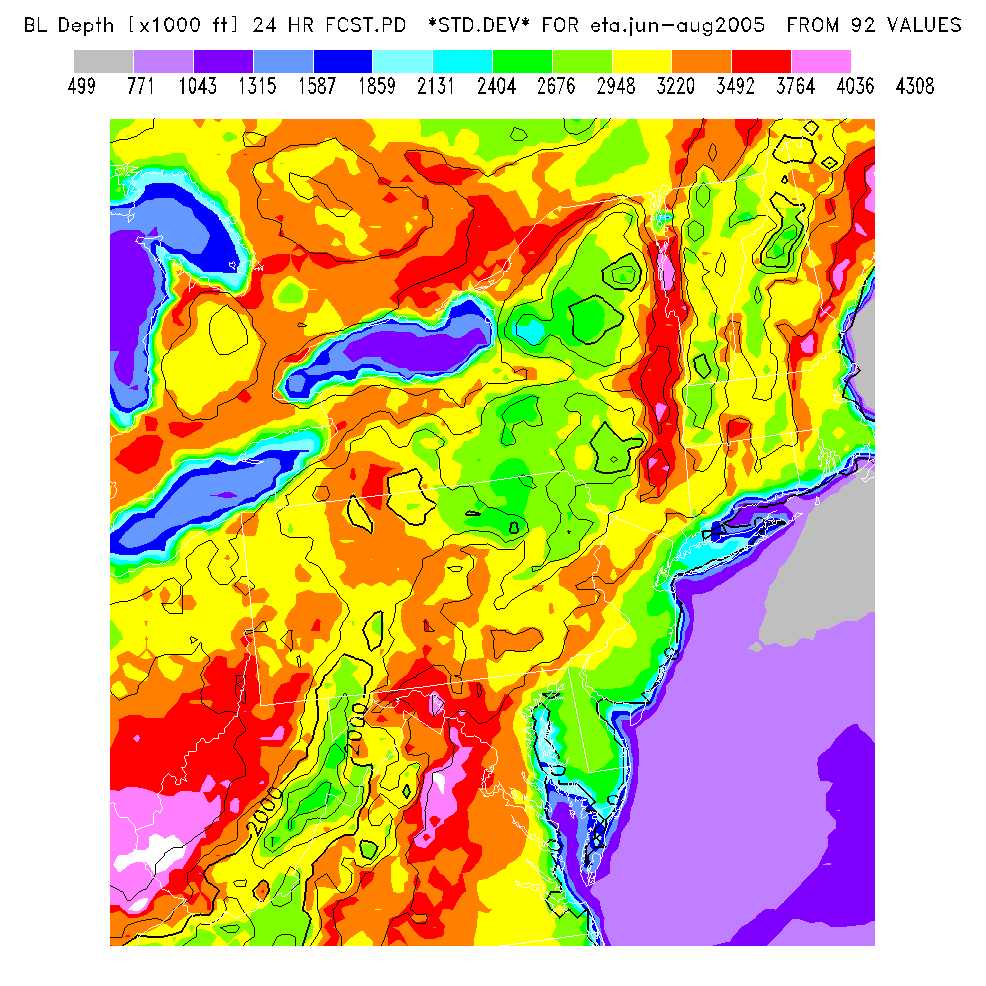
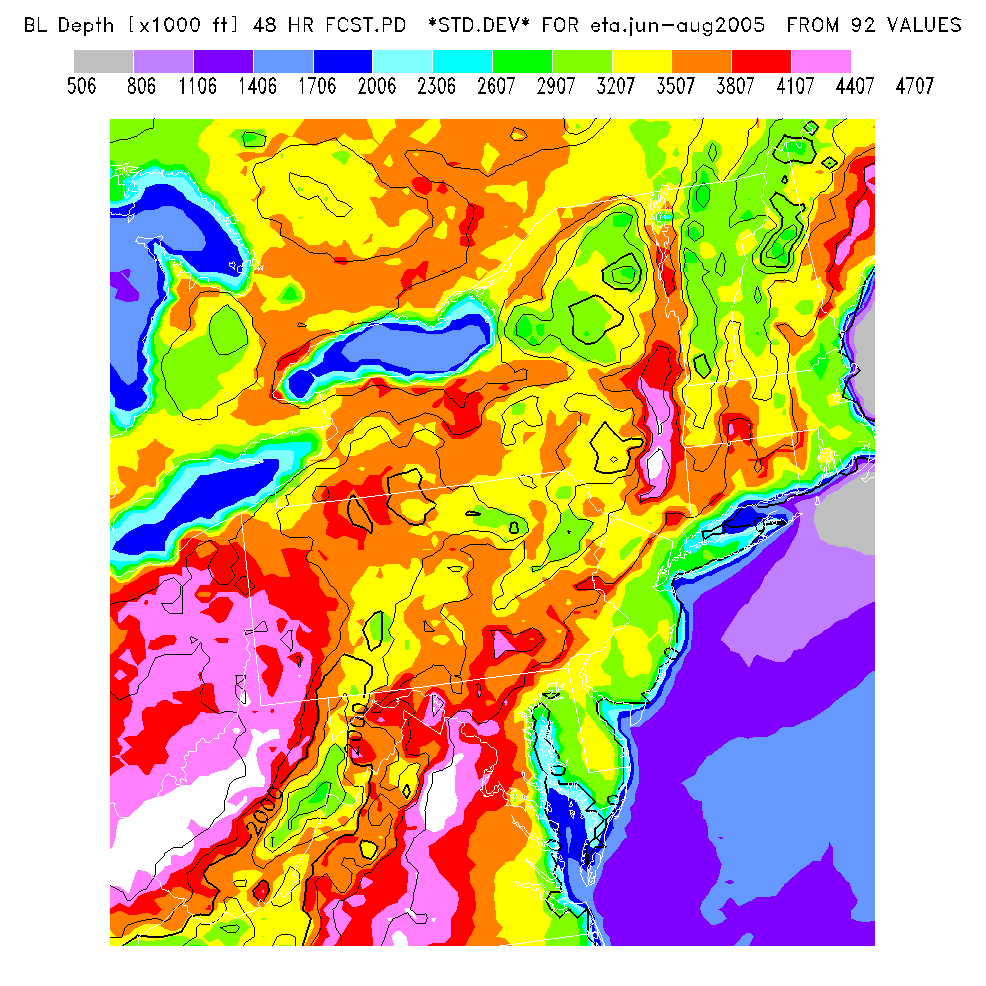
The below tables broadly answer this question for selected parameters from the summer of 2005, summed over all days and over the entire region. The "error" values for each day and location form a bell-shaped curve with a center "bias" value and a spread called the "standard deviation" (2 out of 3 forecasts will have an error smaller than the standard deviation). The standard deviation indicates the "noise" inherent in the forecasts so the standard deviation should get smaller as the forecast period decreases. Ideally the bias would be zero and the standard deviation small. Note that this "error" is "model error" since the reference used is the final (current day) forecast, not an observation - so this says nothing about how the forecasts compare to actual conditions. We've always known that trying to predict exact conditions days in advance is risky, but I've never before had actual numbers to go on so this provides some idea of the expected error. Some may find the error in the advance predictions disappointingly large, but that's the nature of weather prediction.
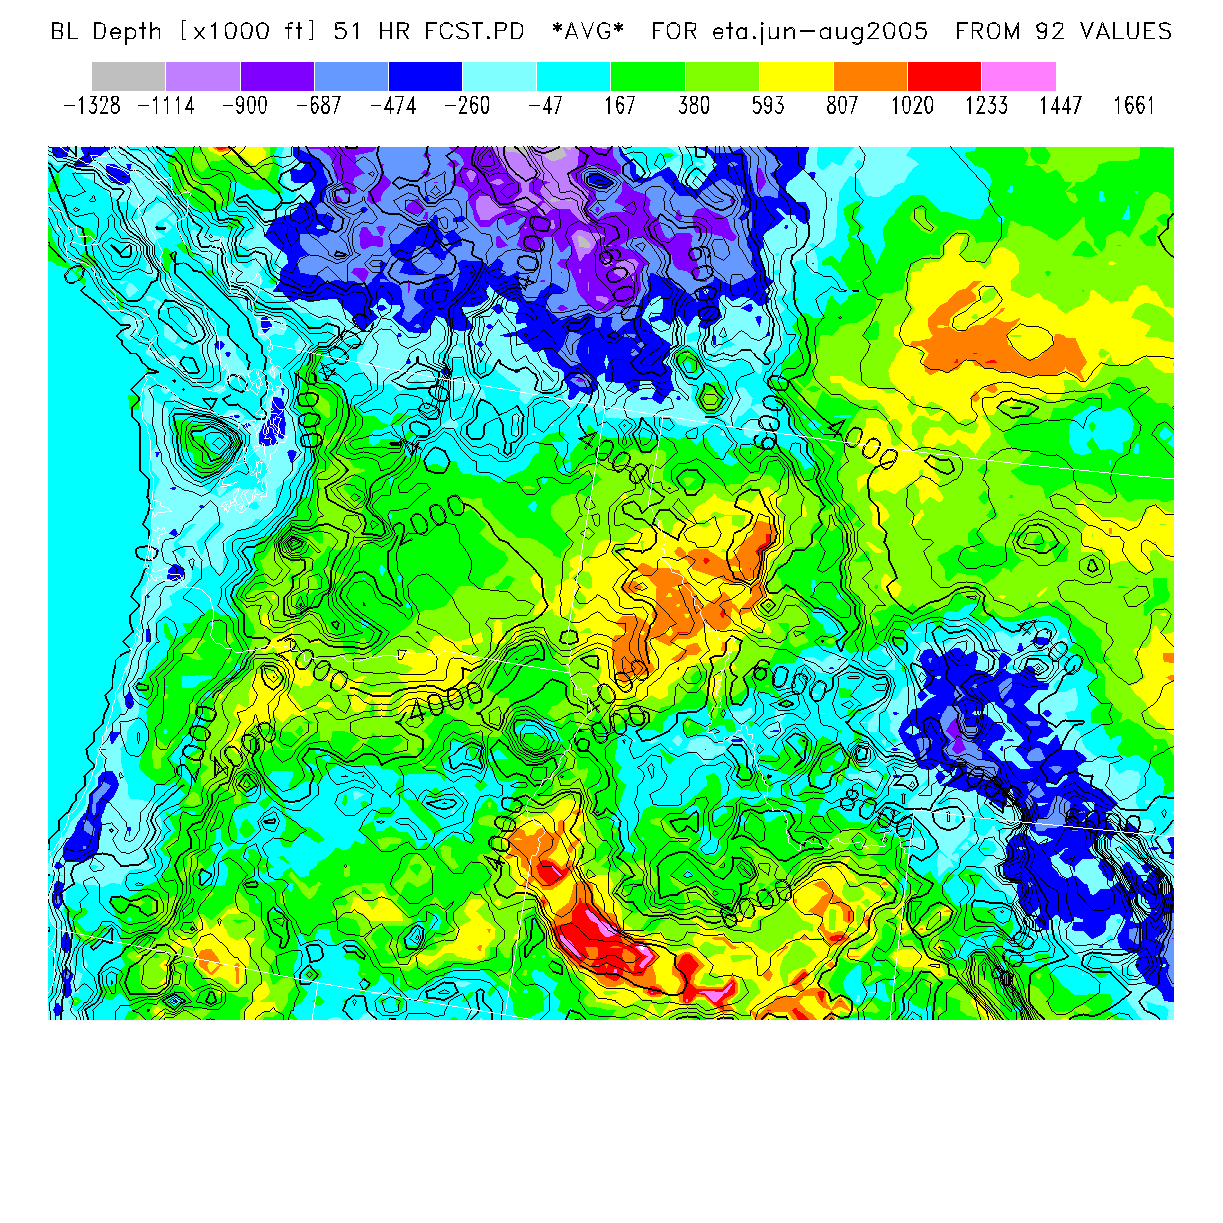
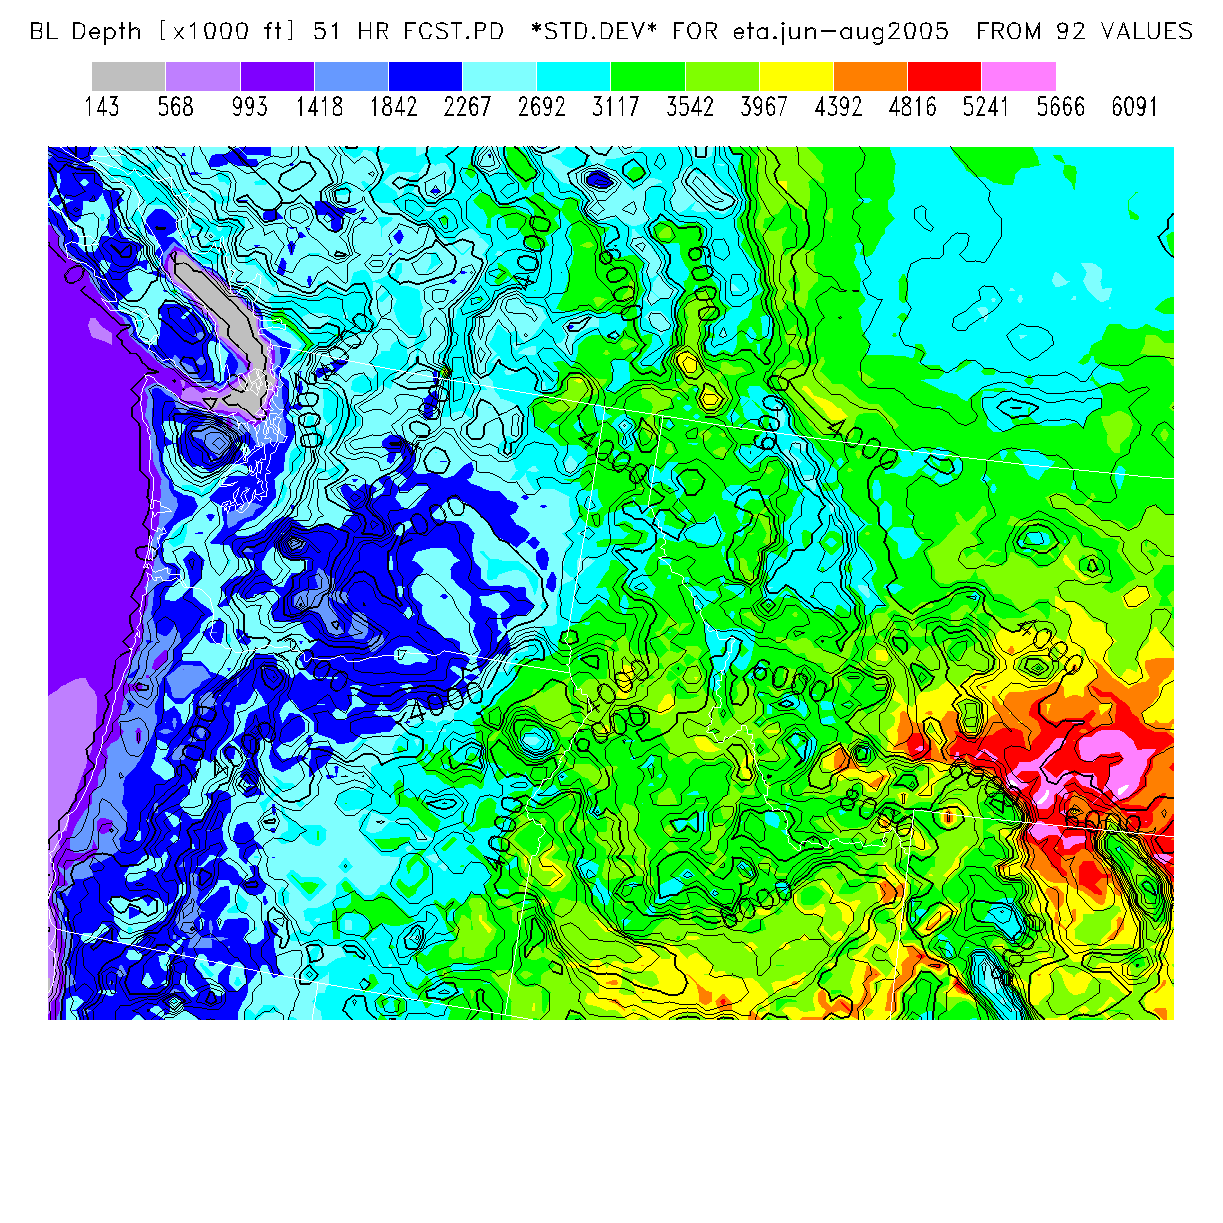
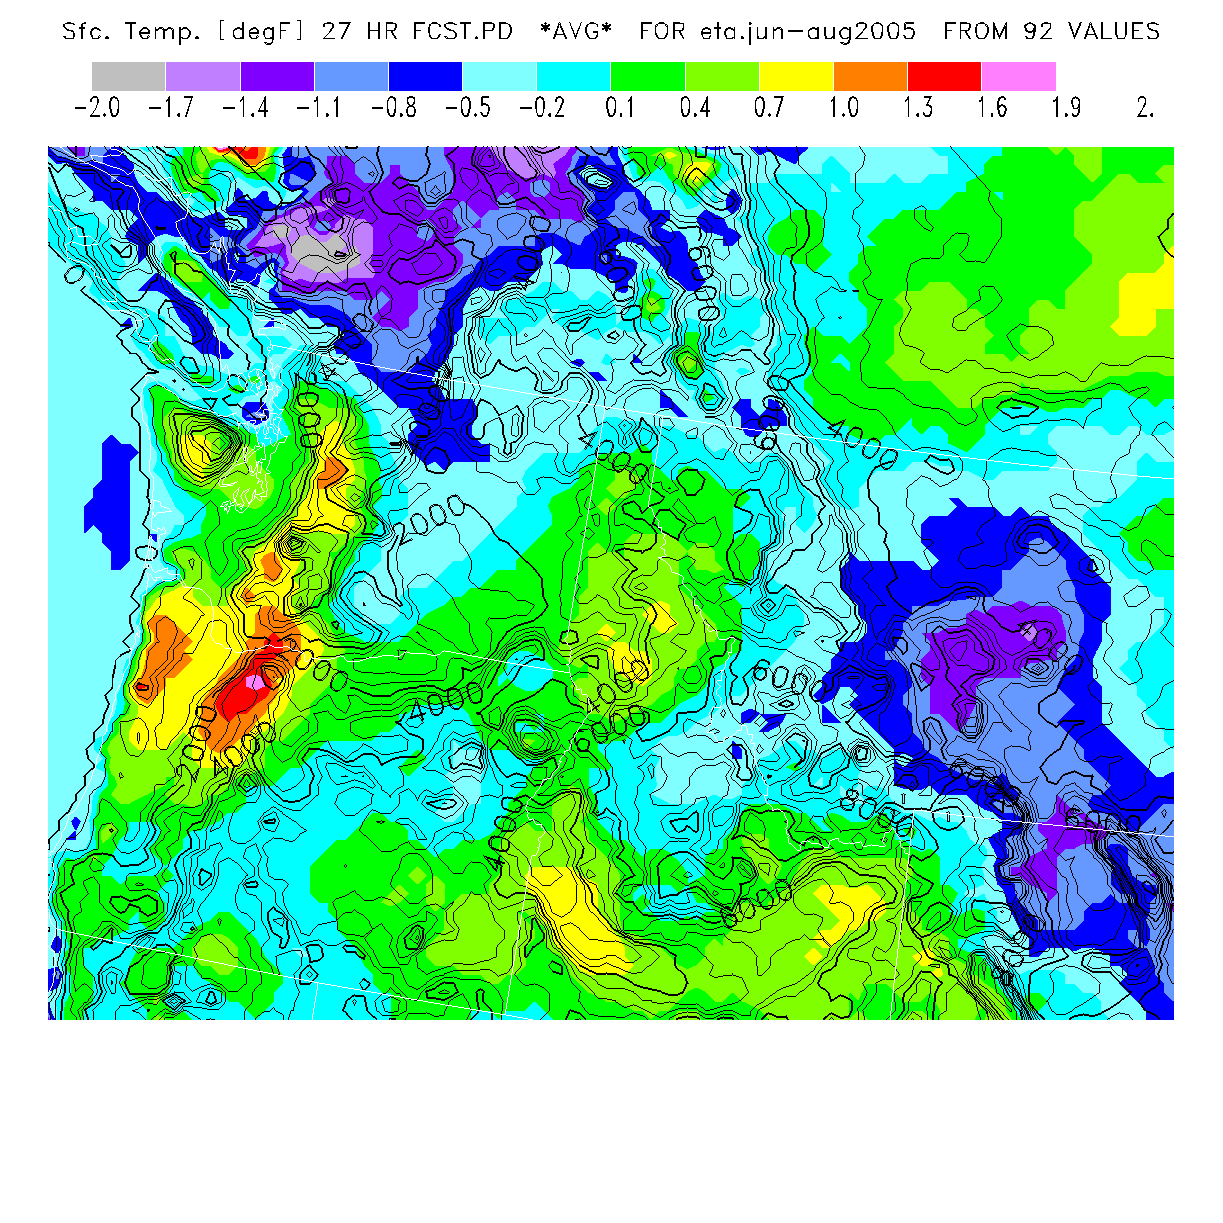
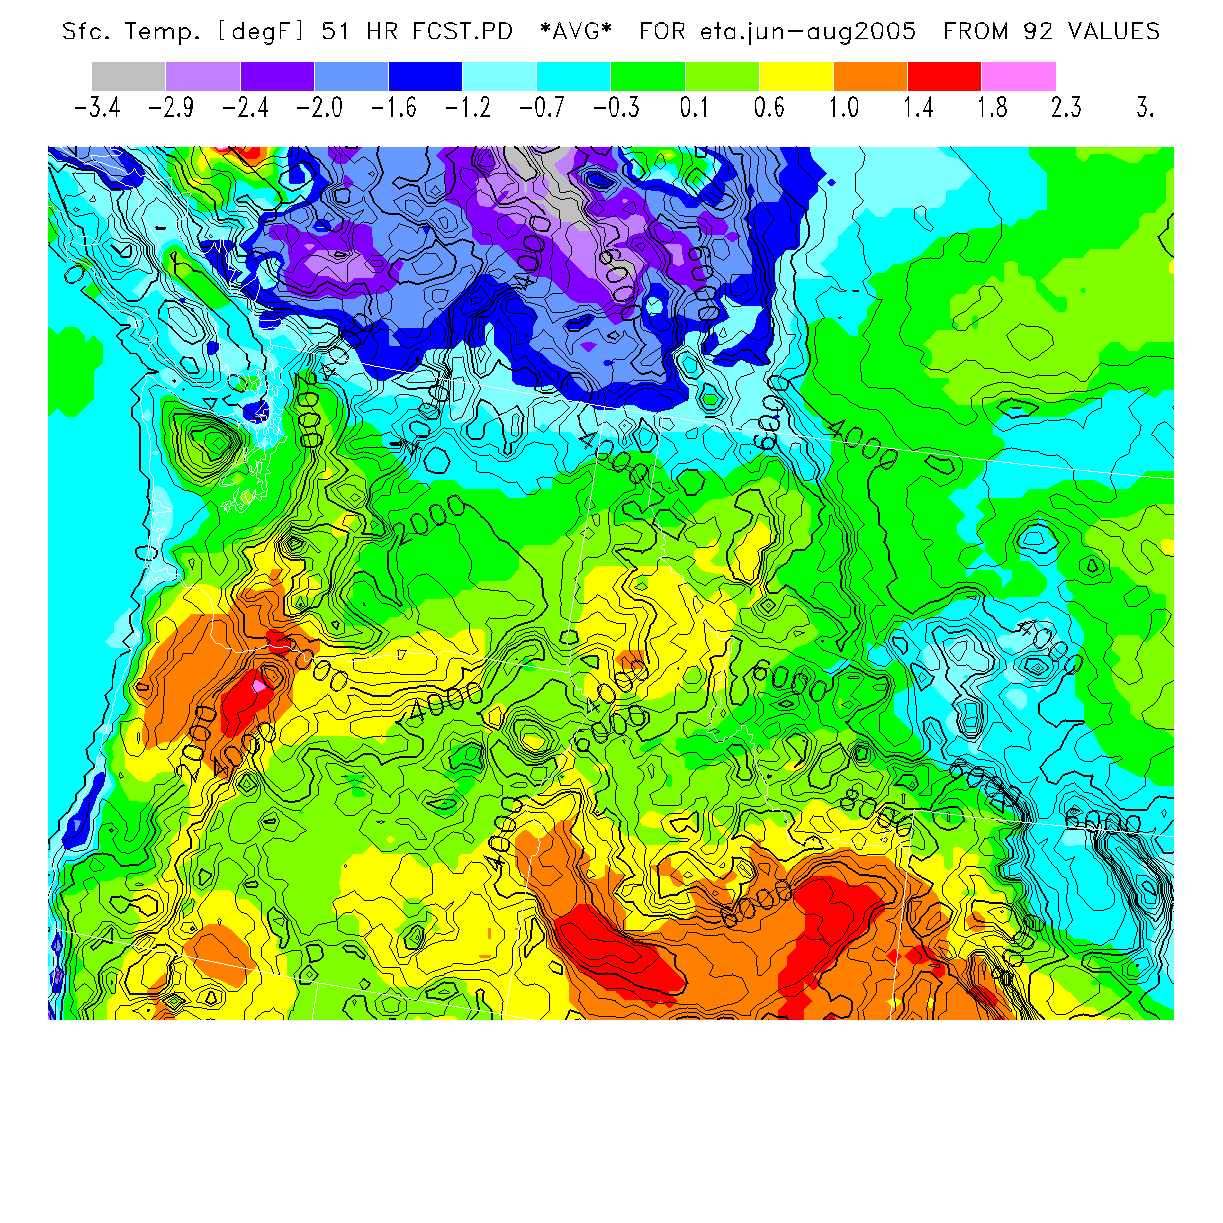
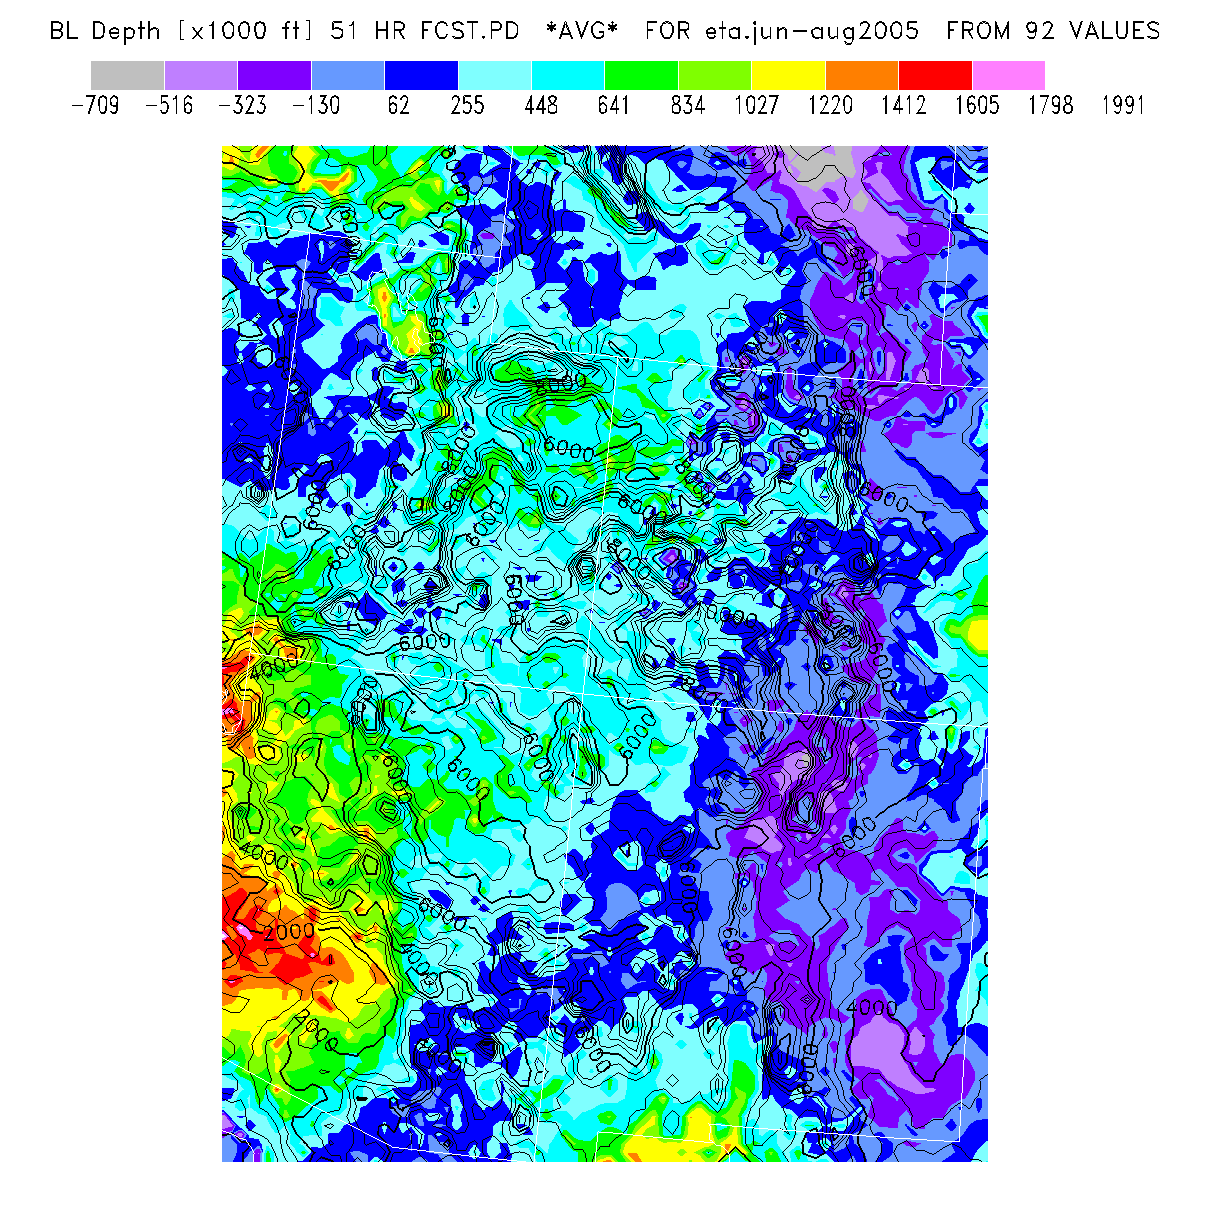
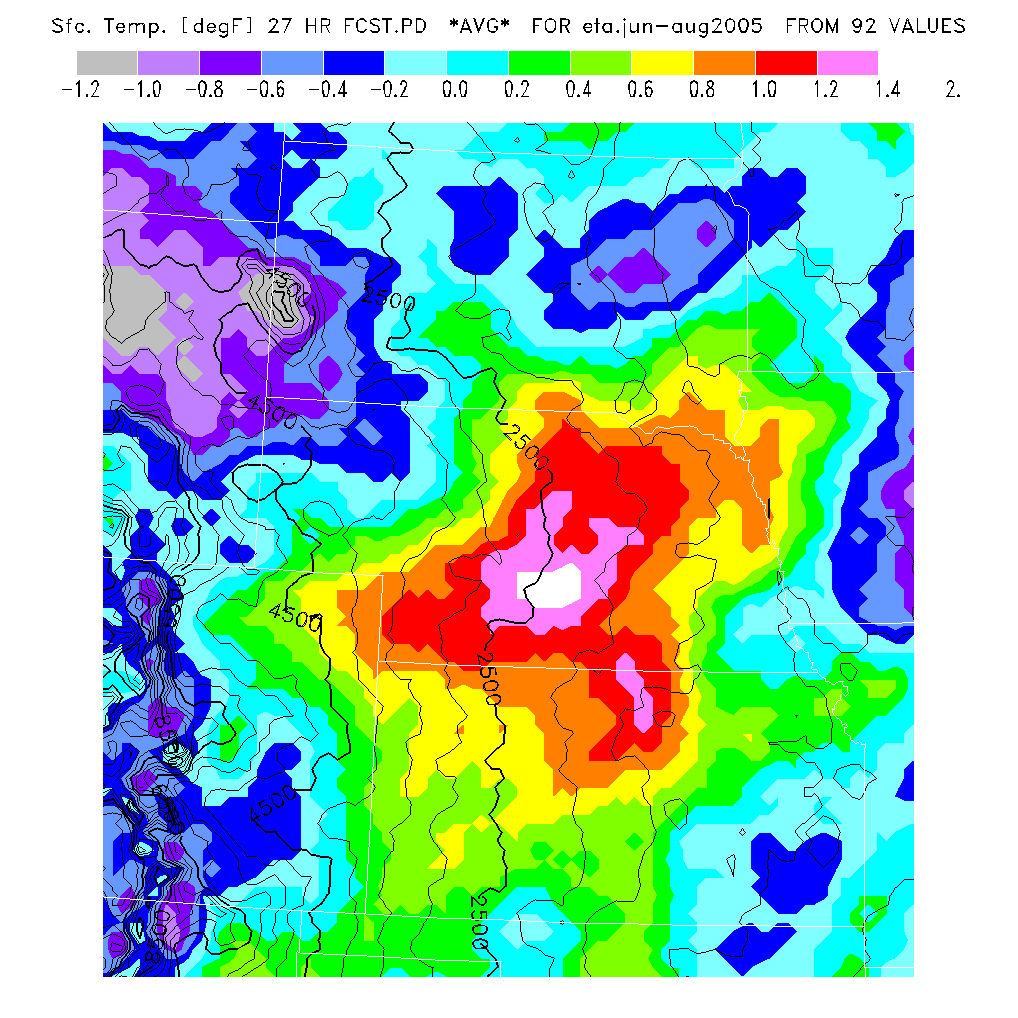
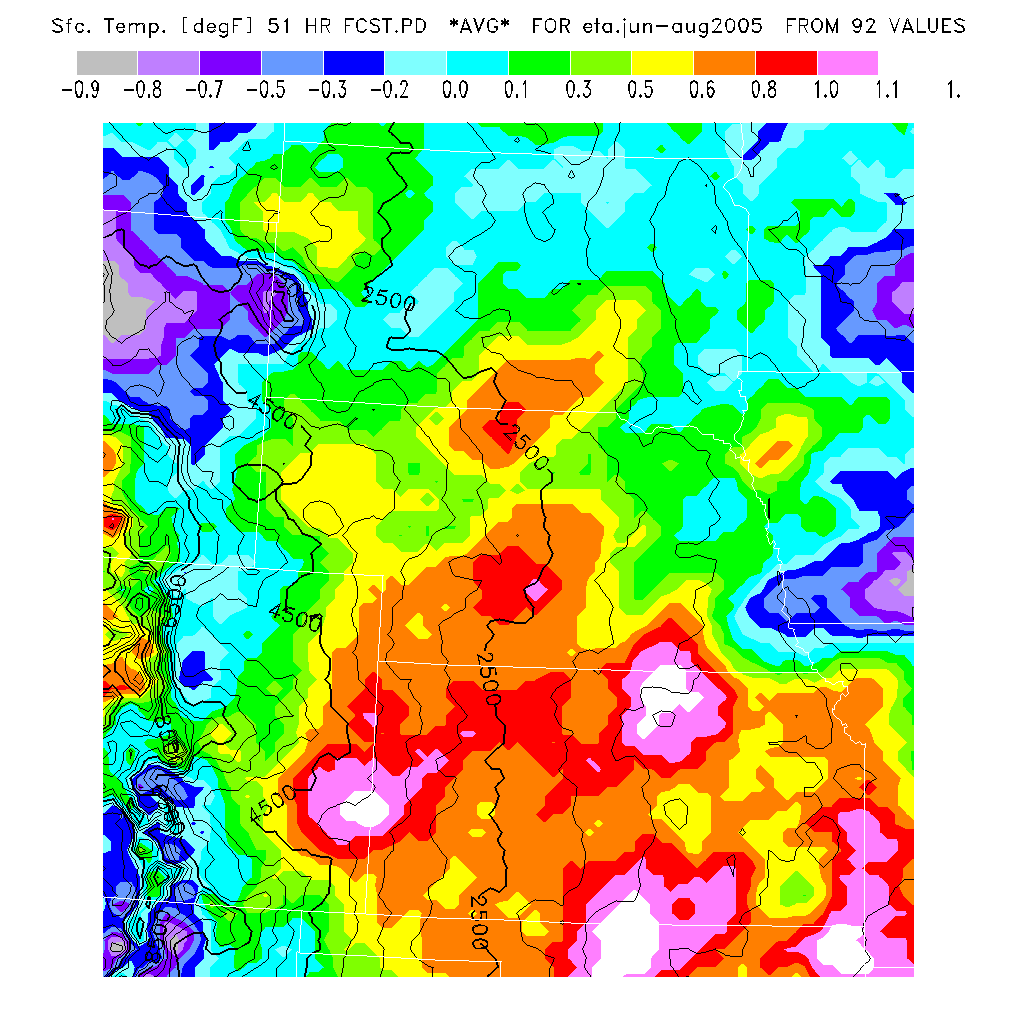
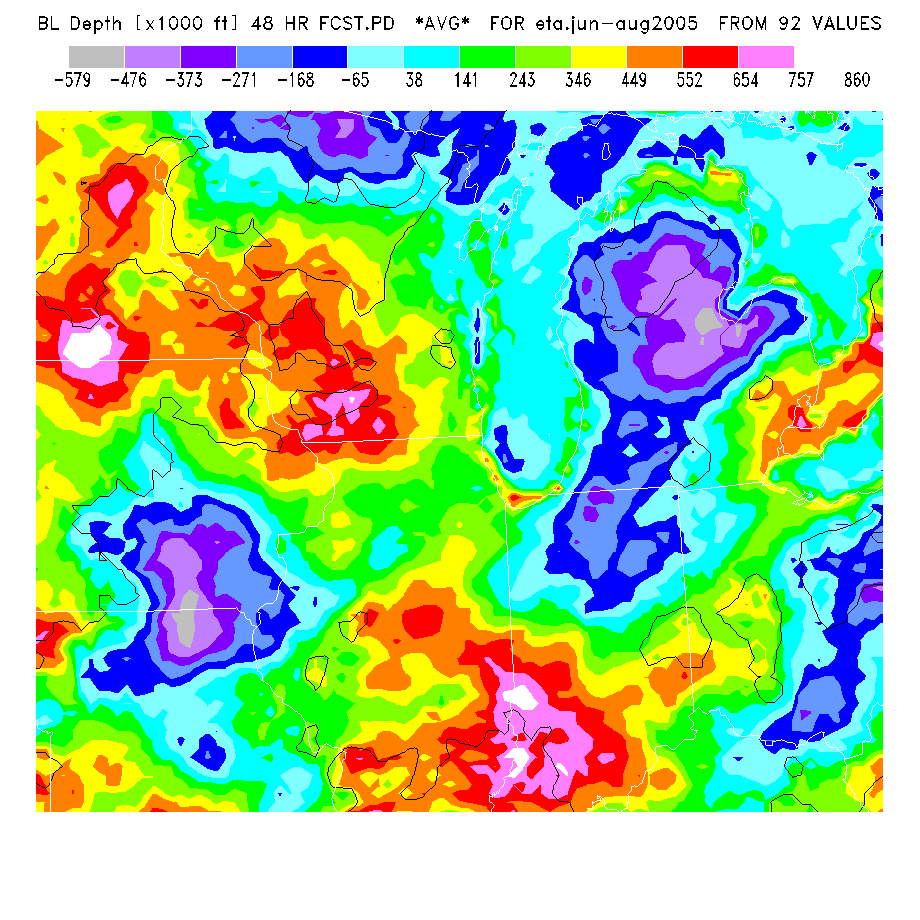
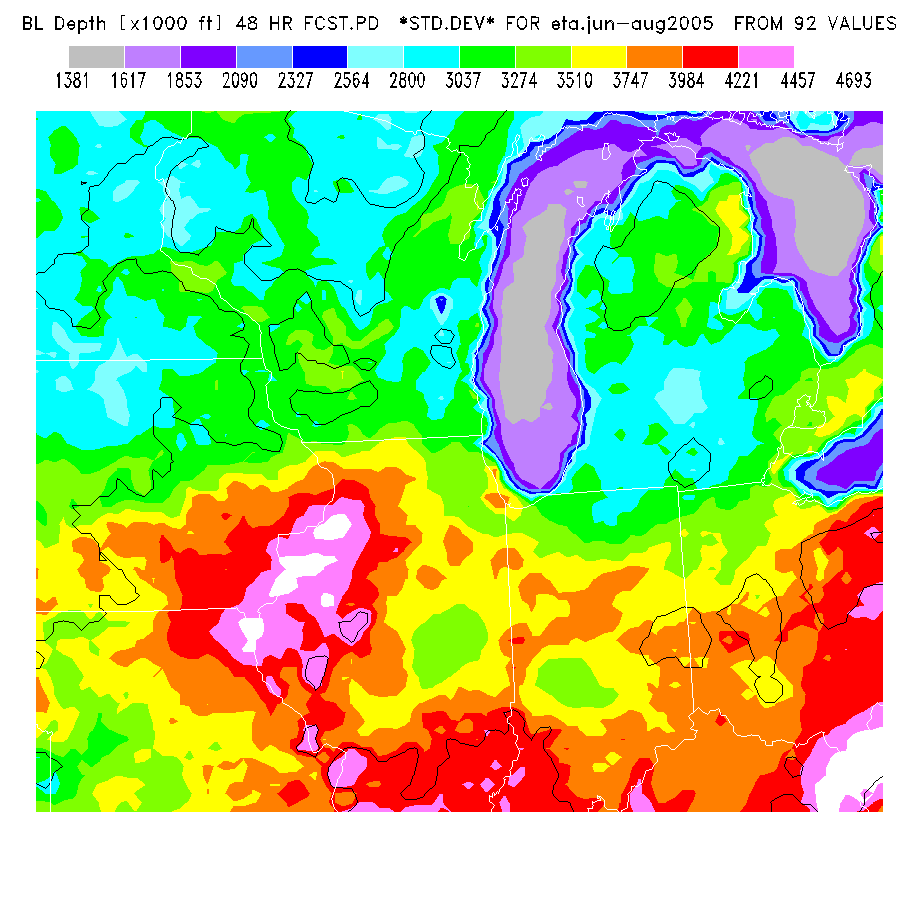
A positive bias indicates "over-prediction", i.e. the advance prediction was larger than actually forecast for the current day. Bias values in the tables indicate that the advance day forecast values are generally "over-predicted", i.e. overly optimistic, with the "current+2" day being more optimistic than the "current+1" day. But the biases are generally small compared to the "noise", represented by the standard deviation. As expected, the standard deviation is always largest for the "current+2" day. The "best" advance predictions are those for the CA-NV region, but this is likely biased because a significant fraction of the domain is ocean.
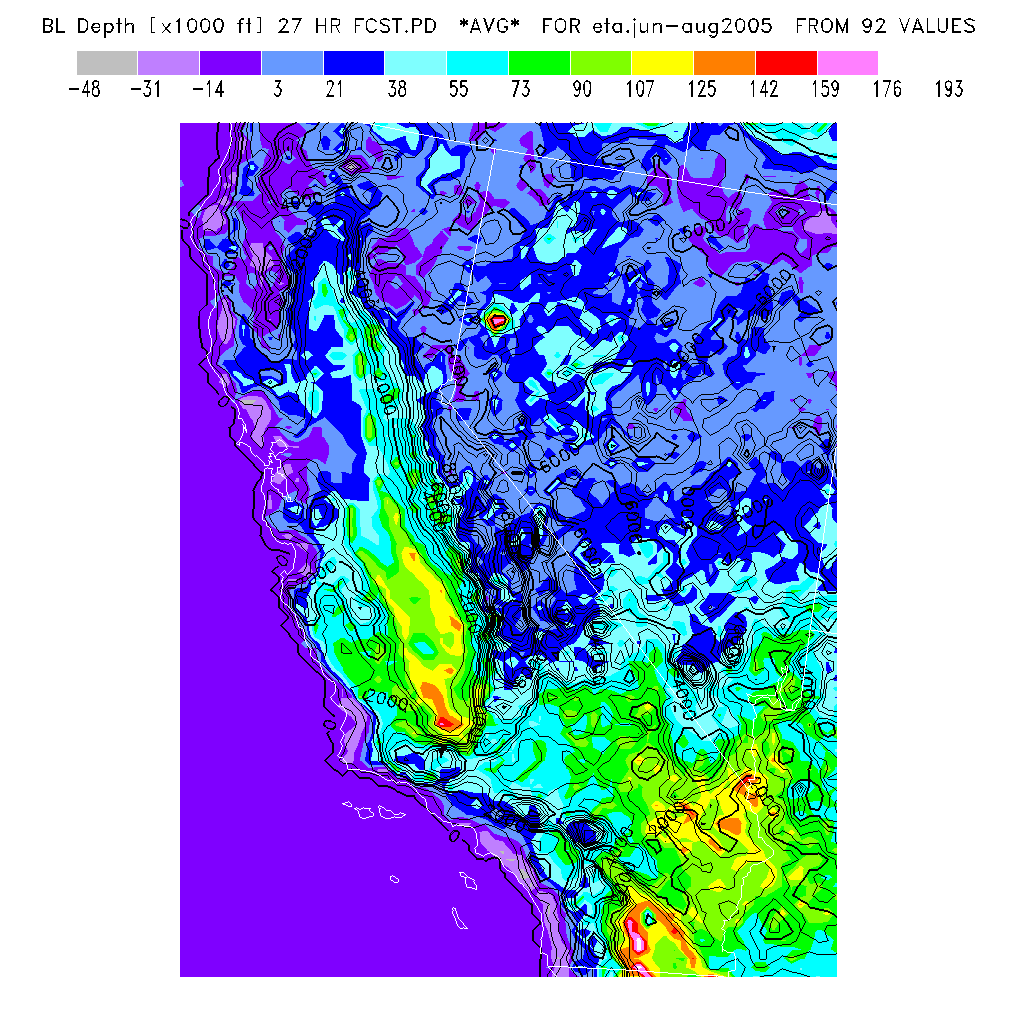
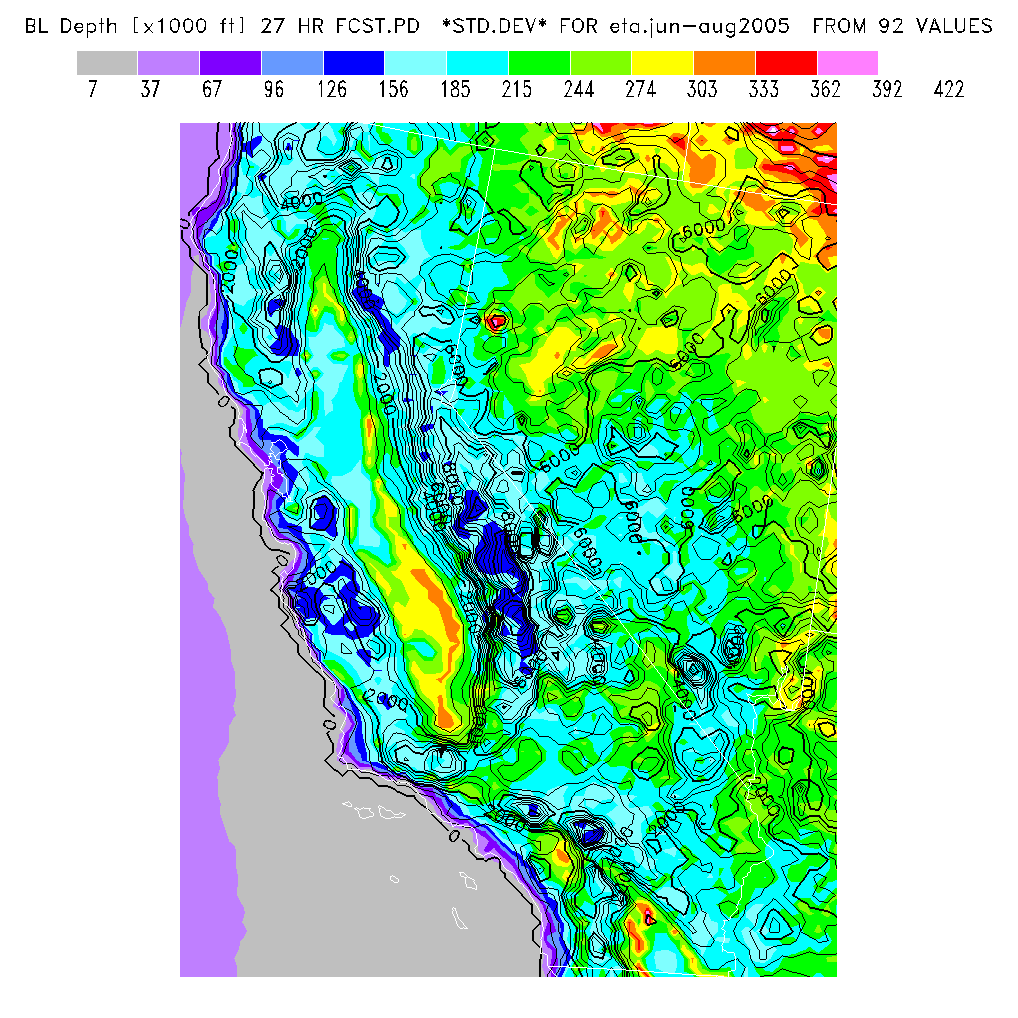
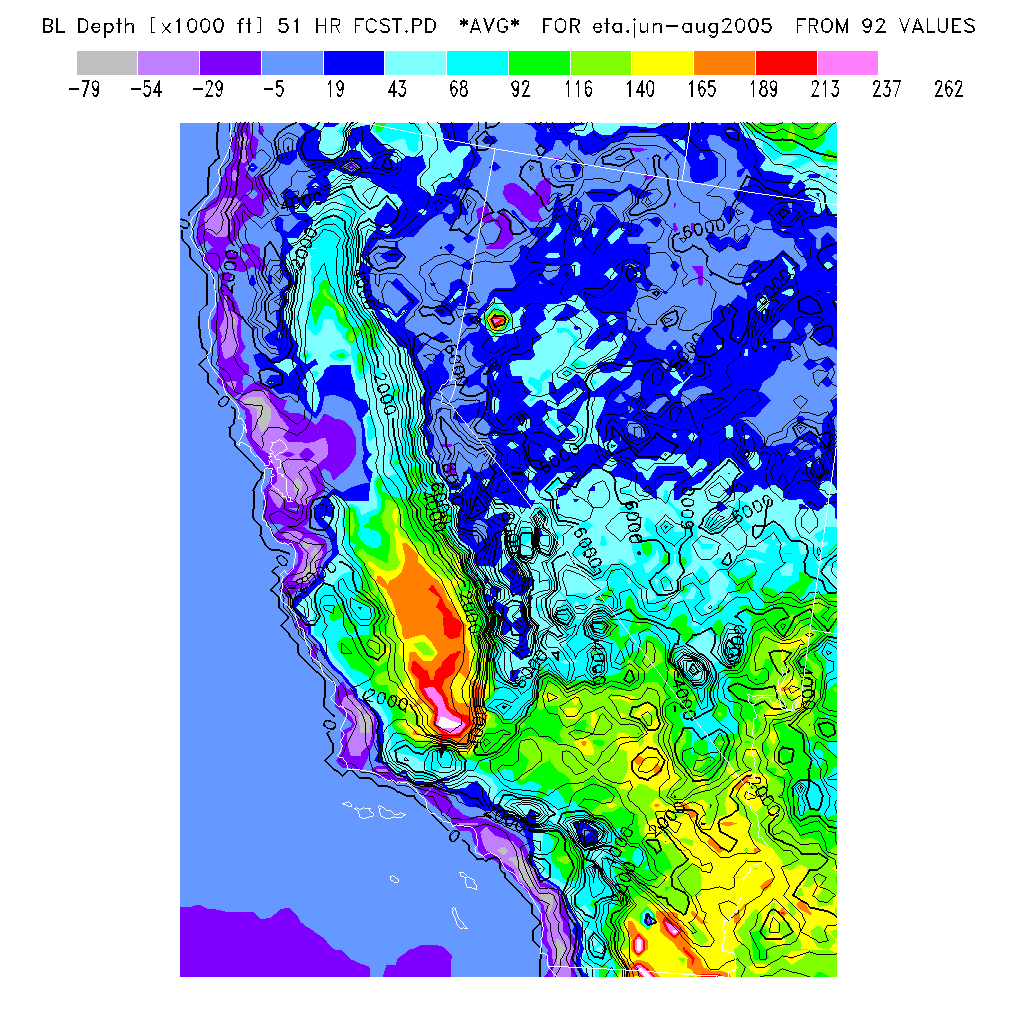
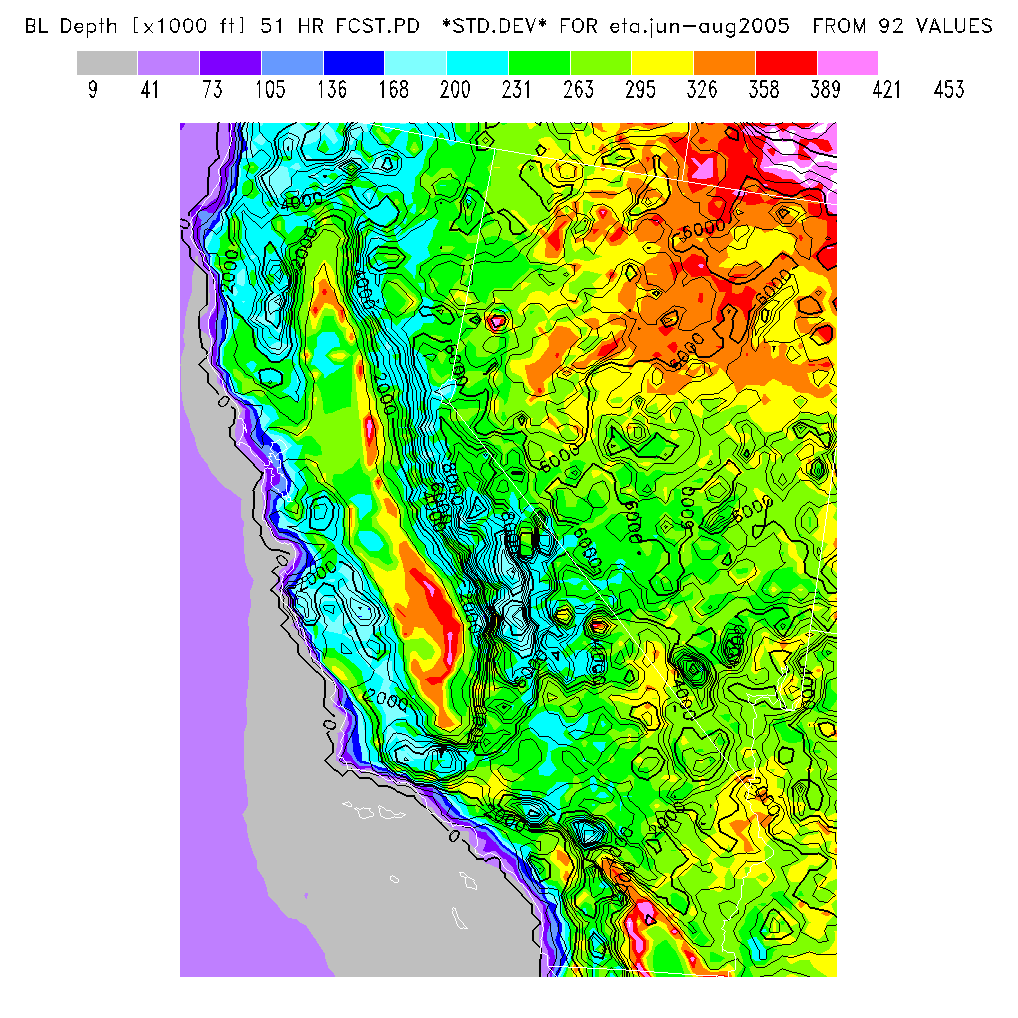
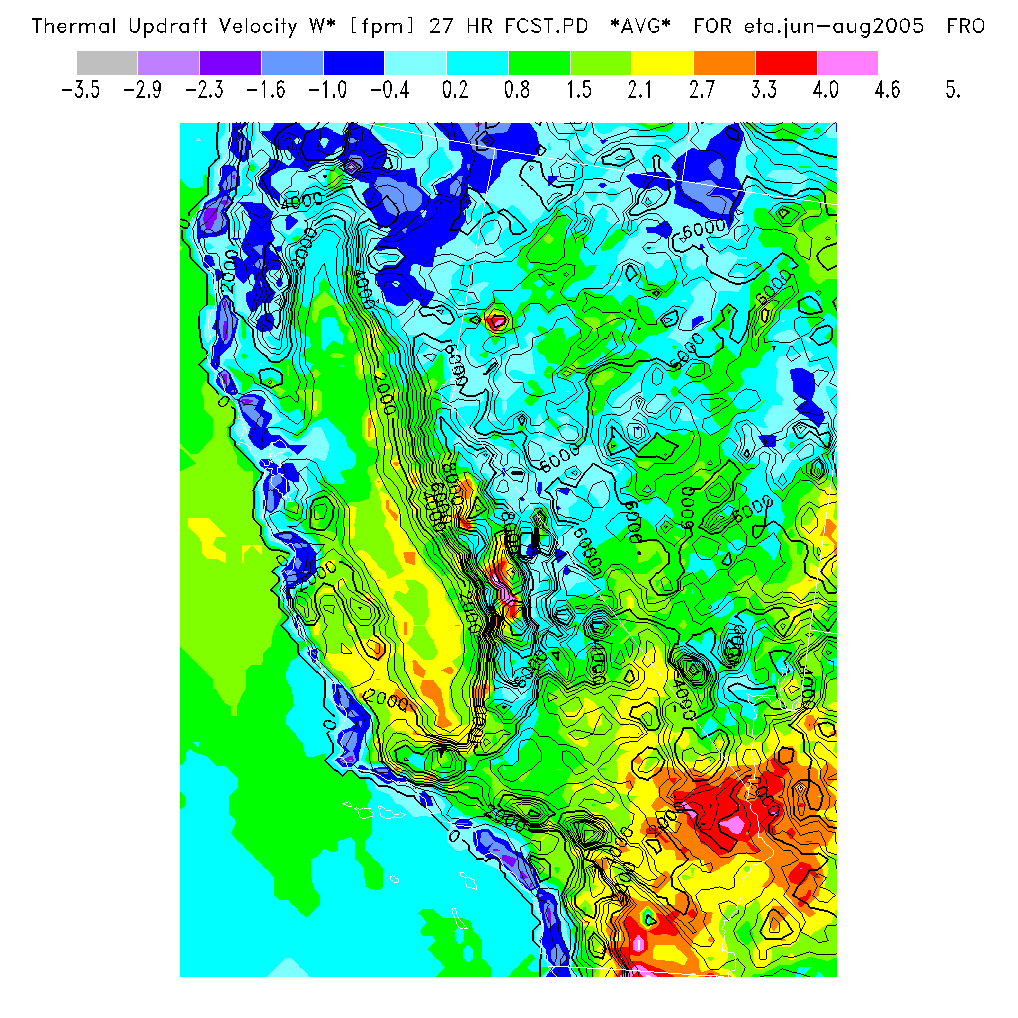
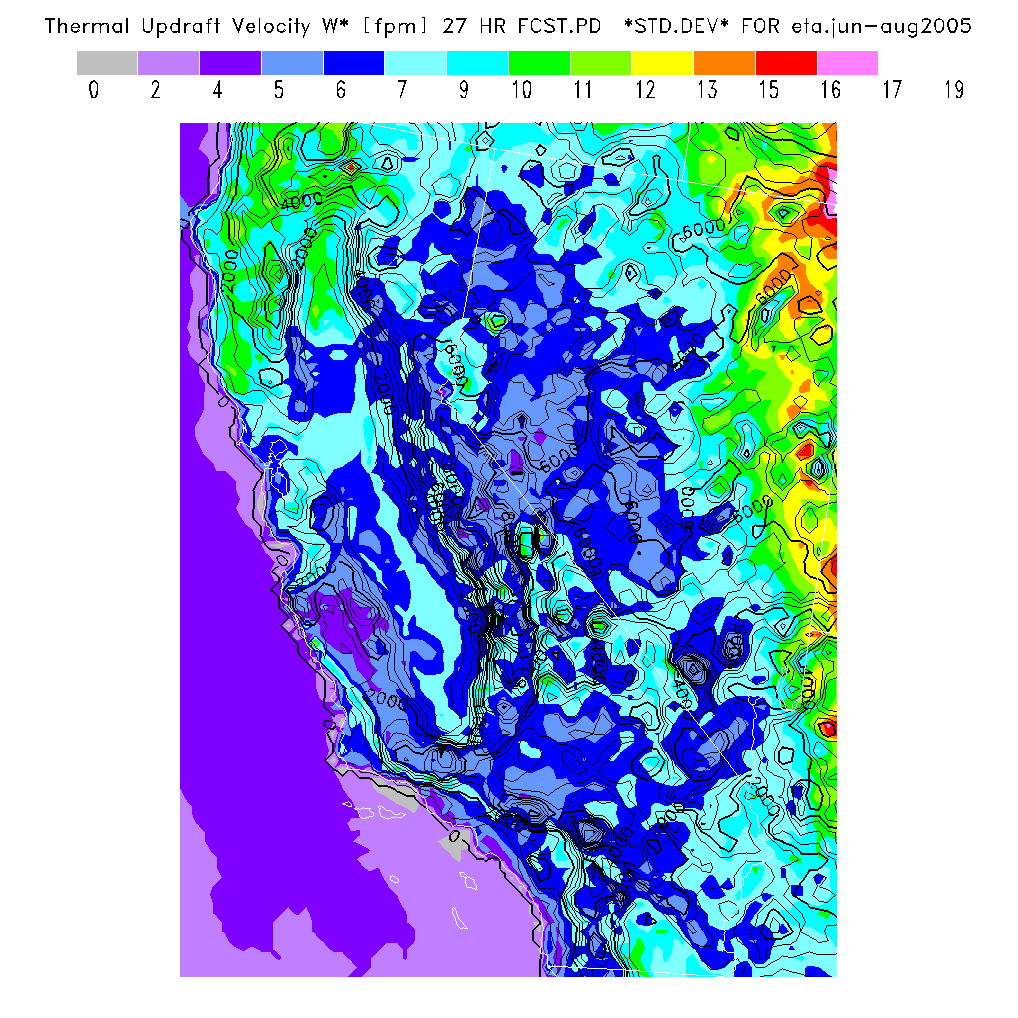
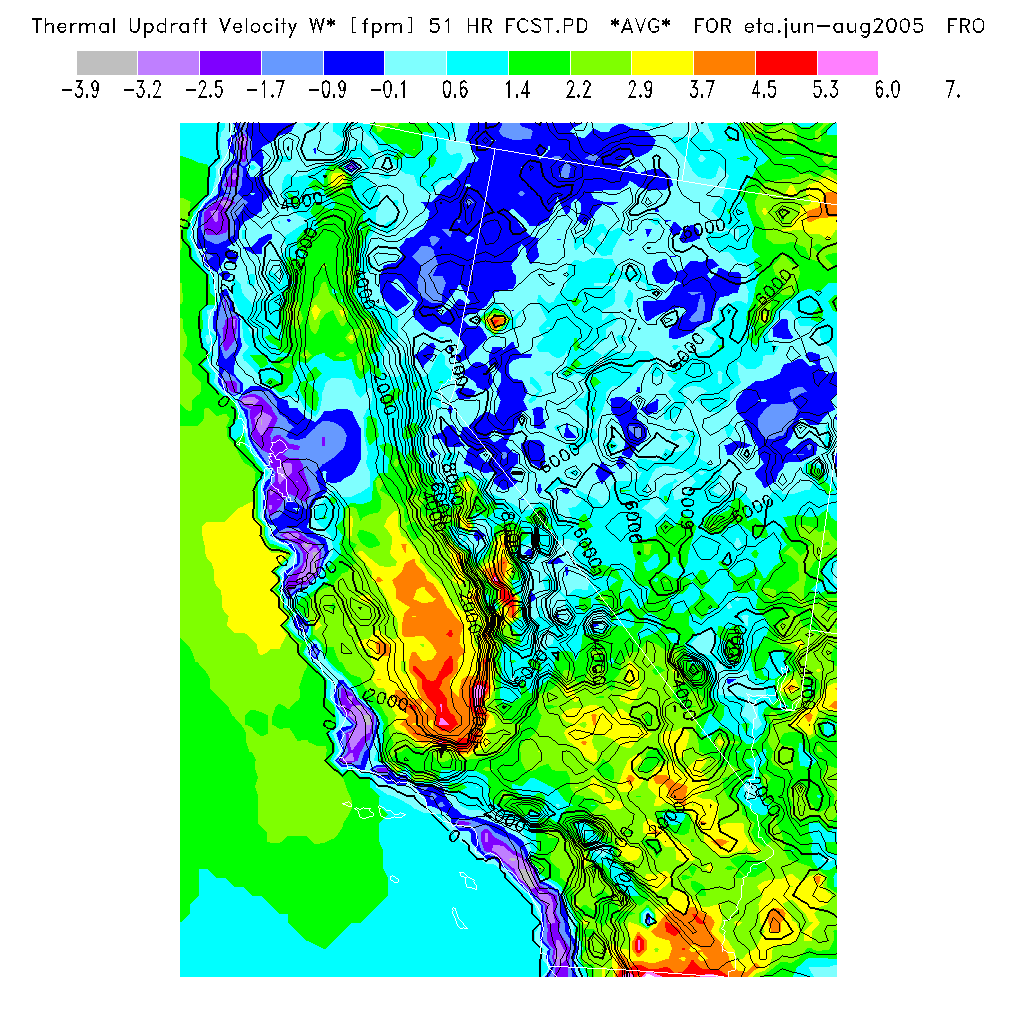
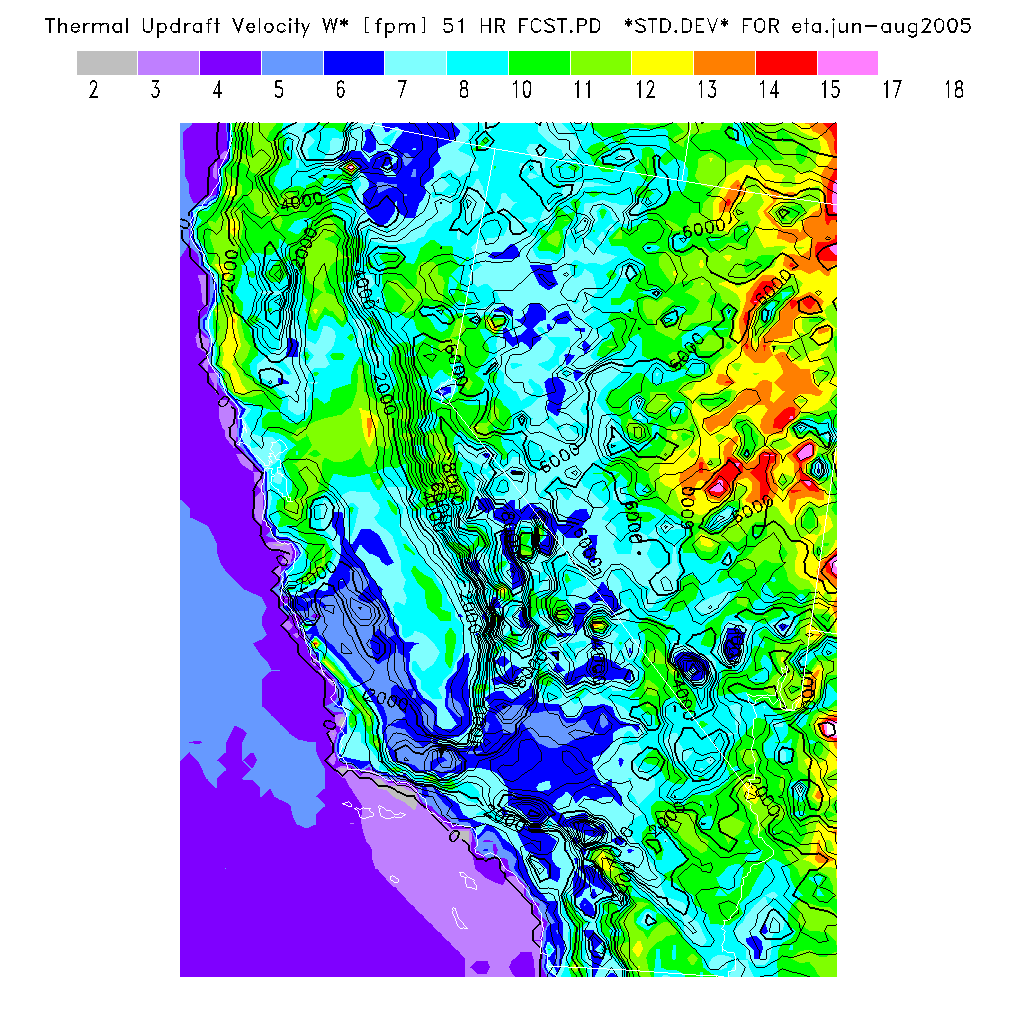
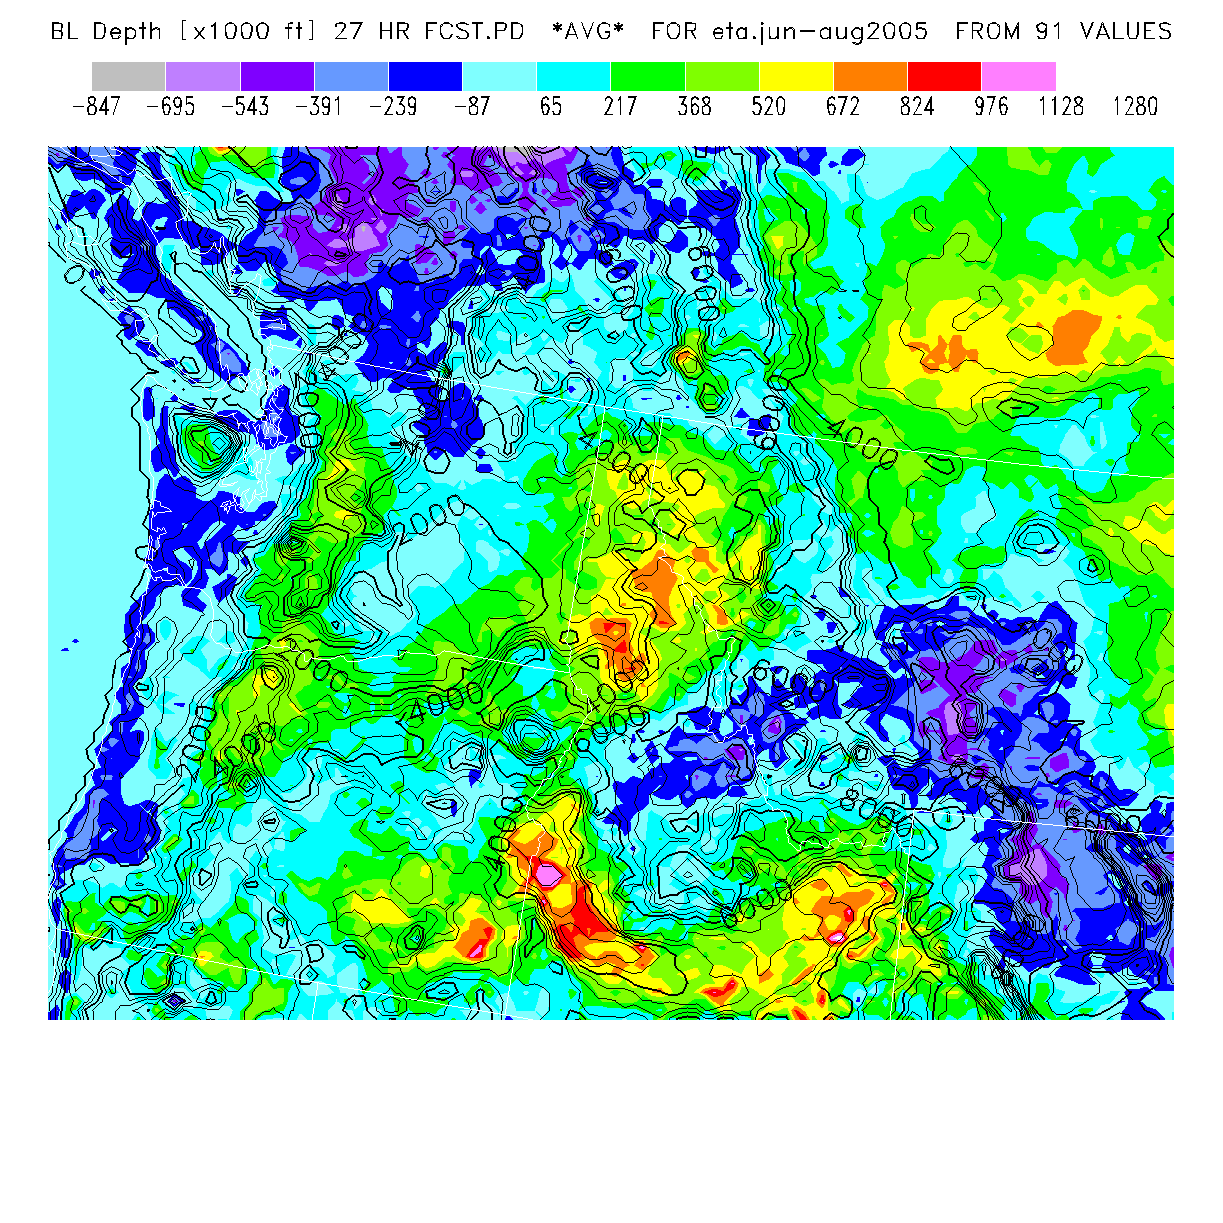
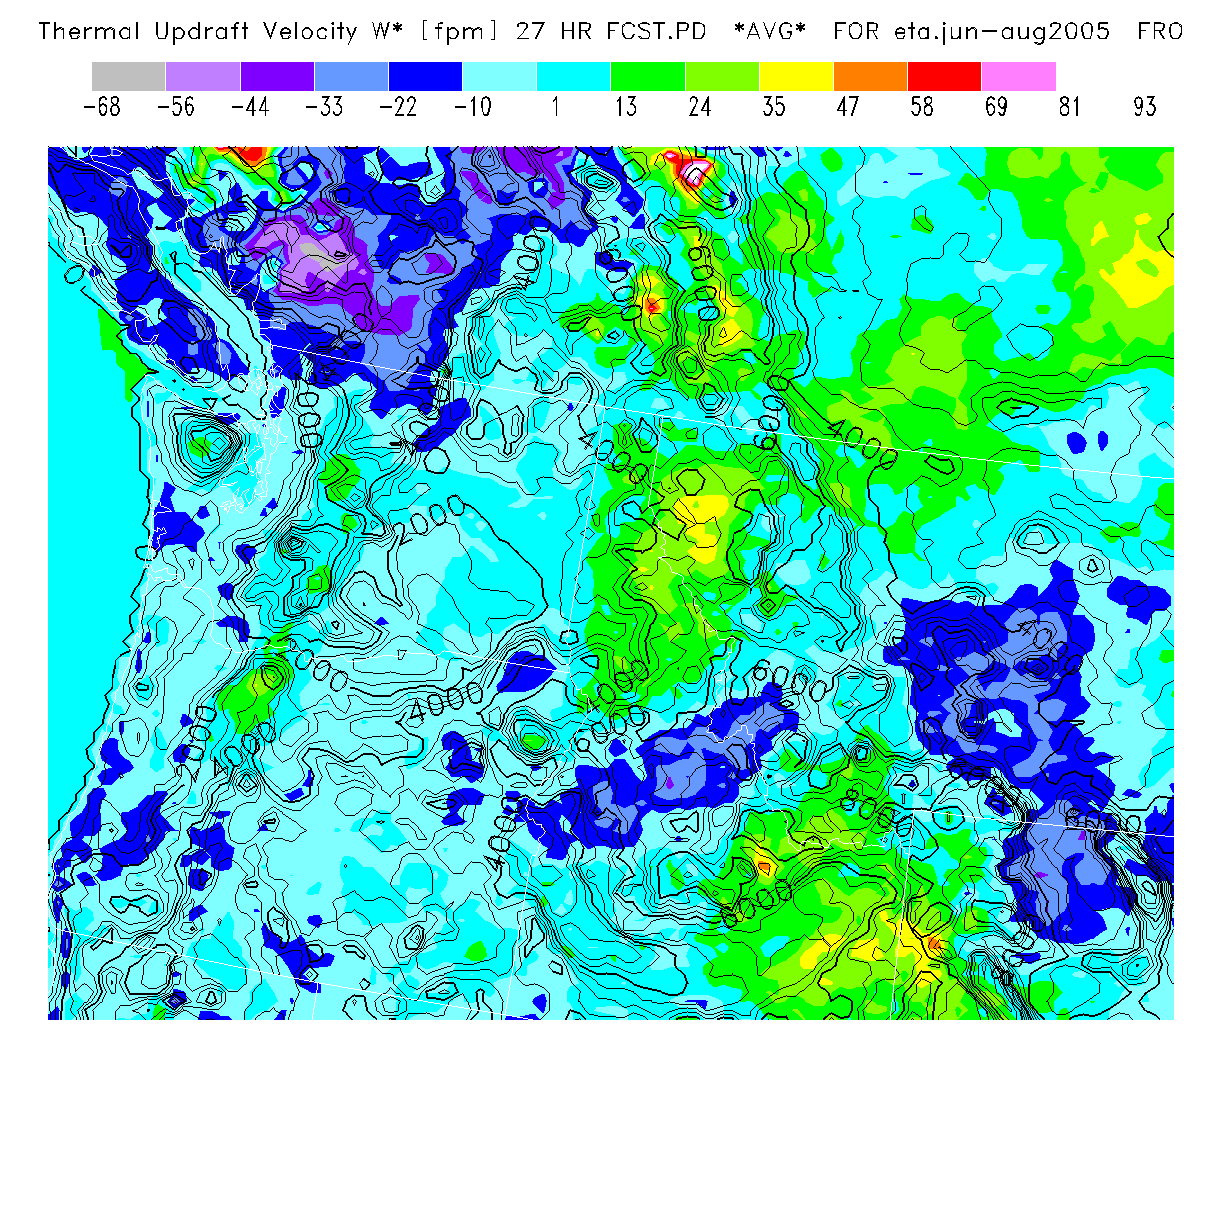
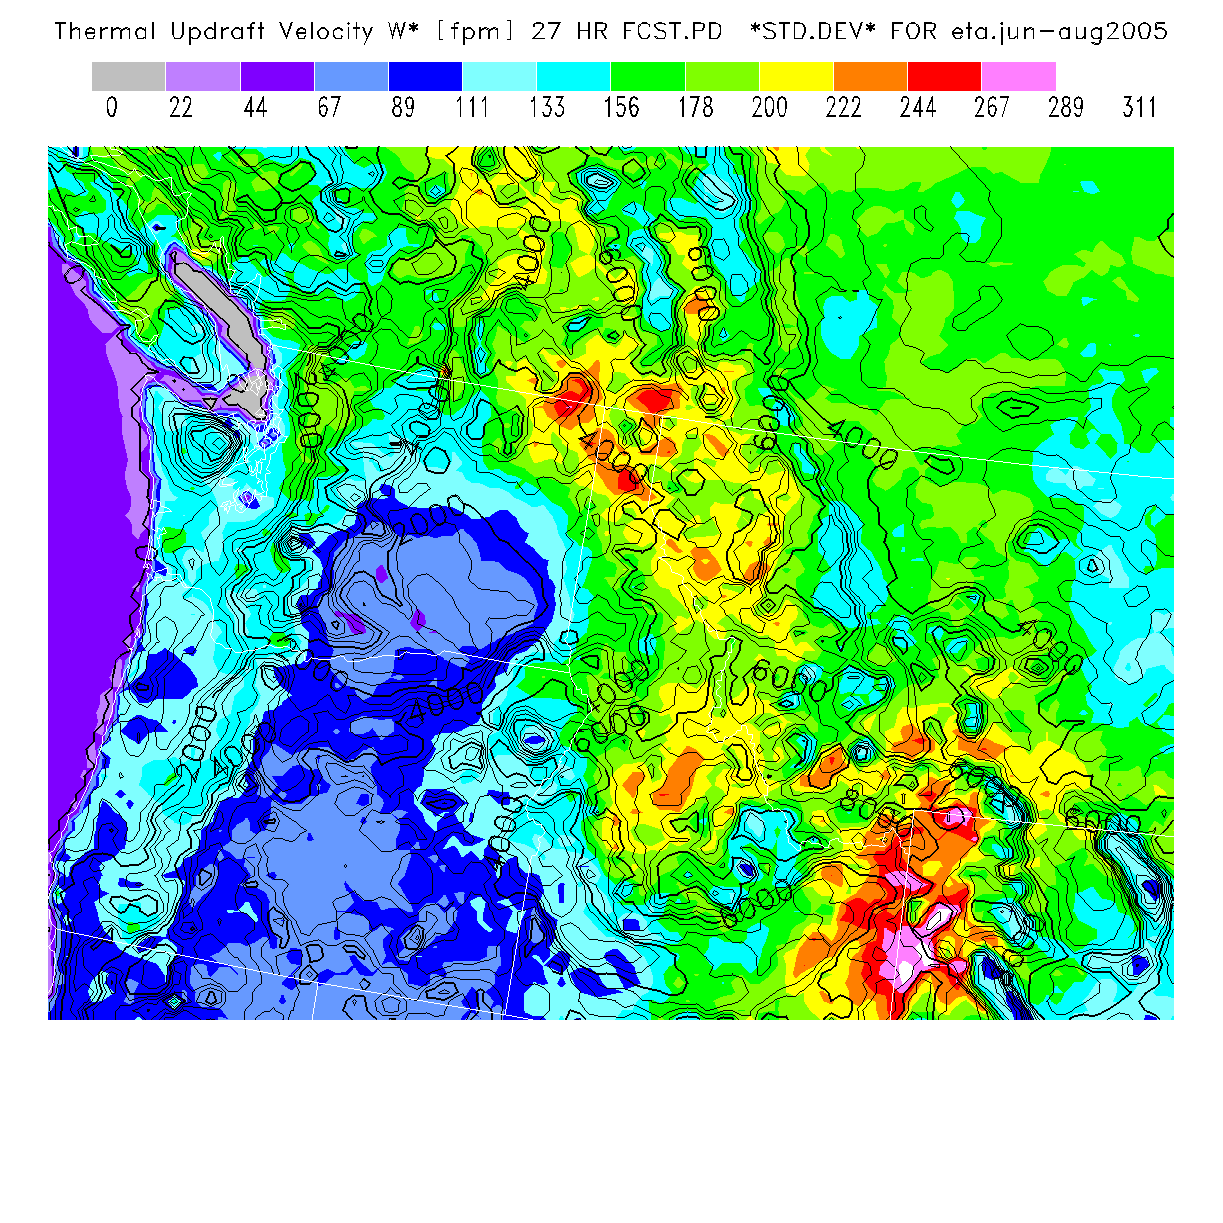
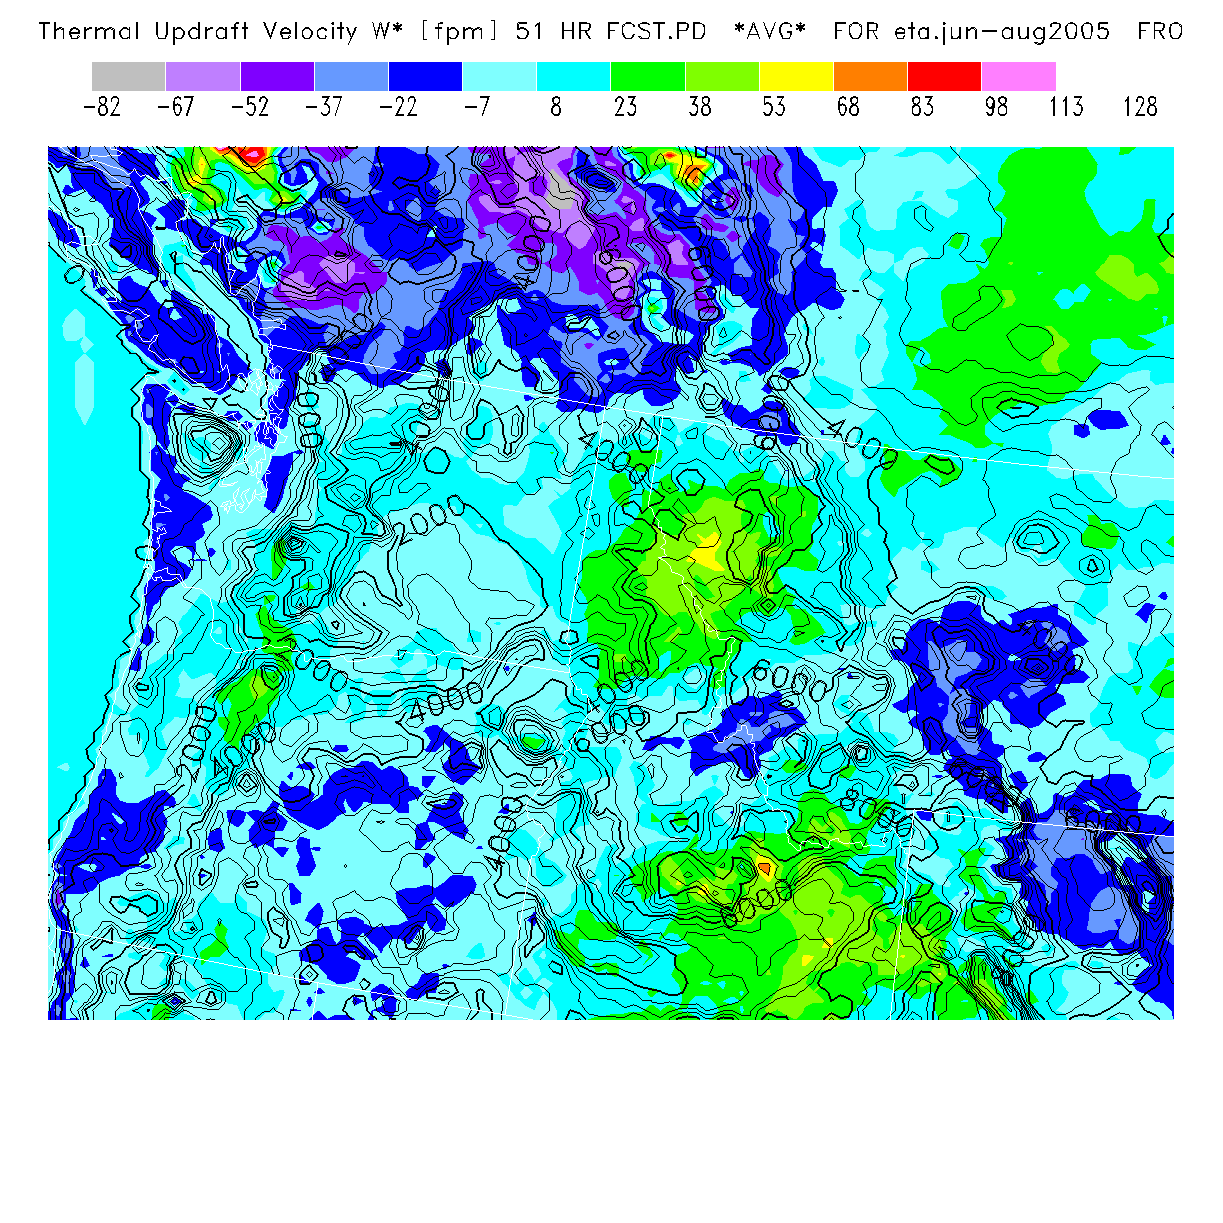
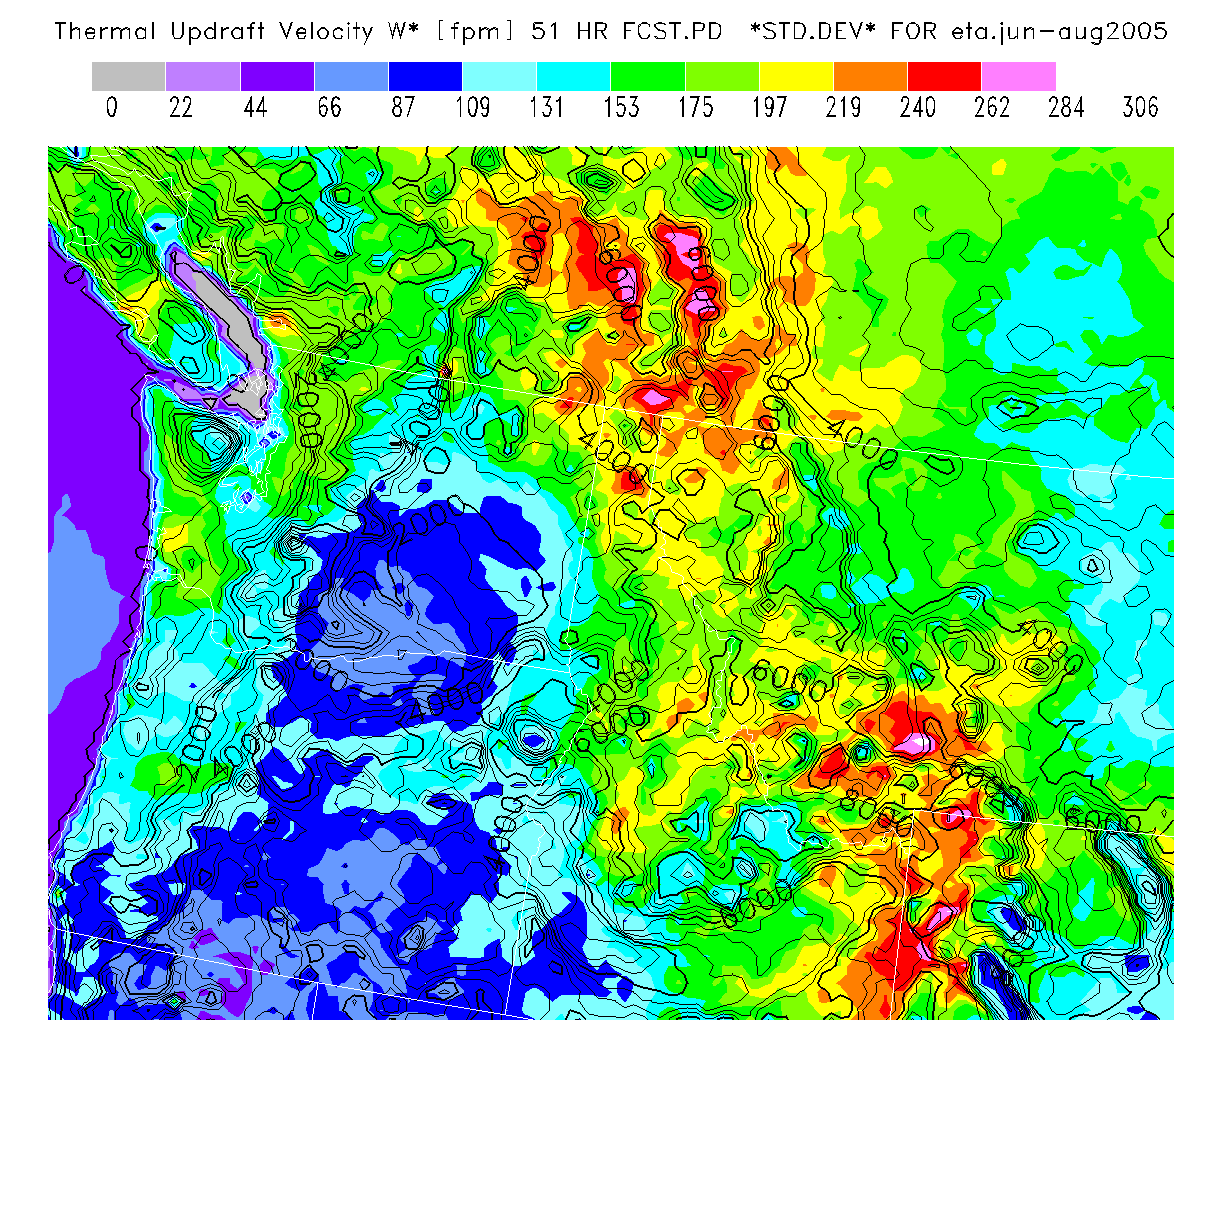
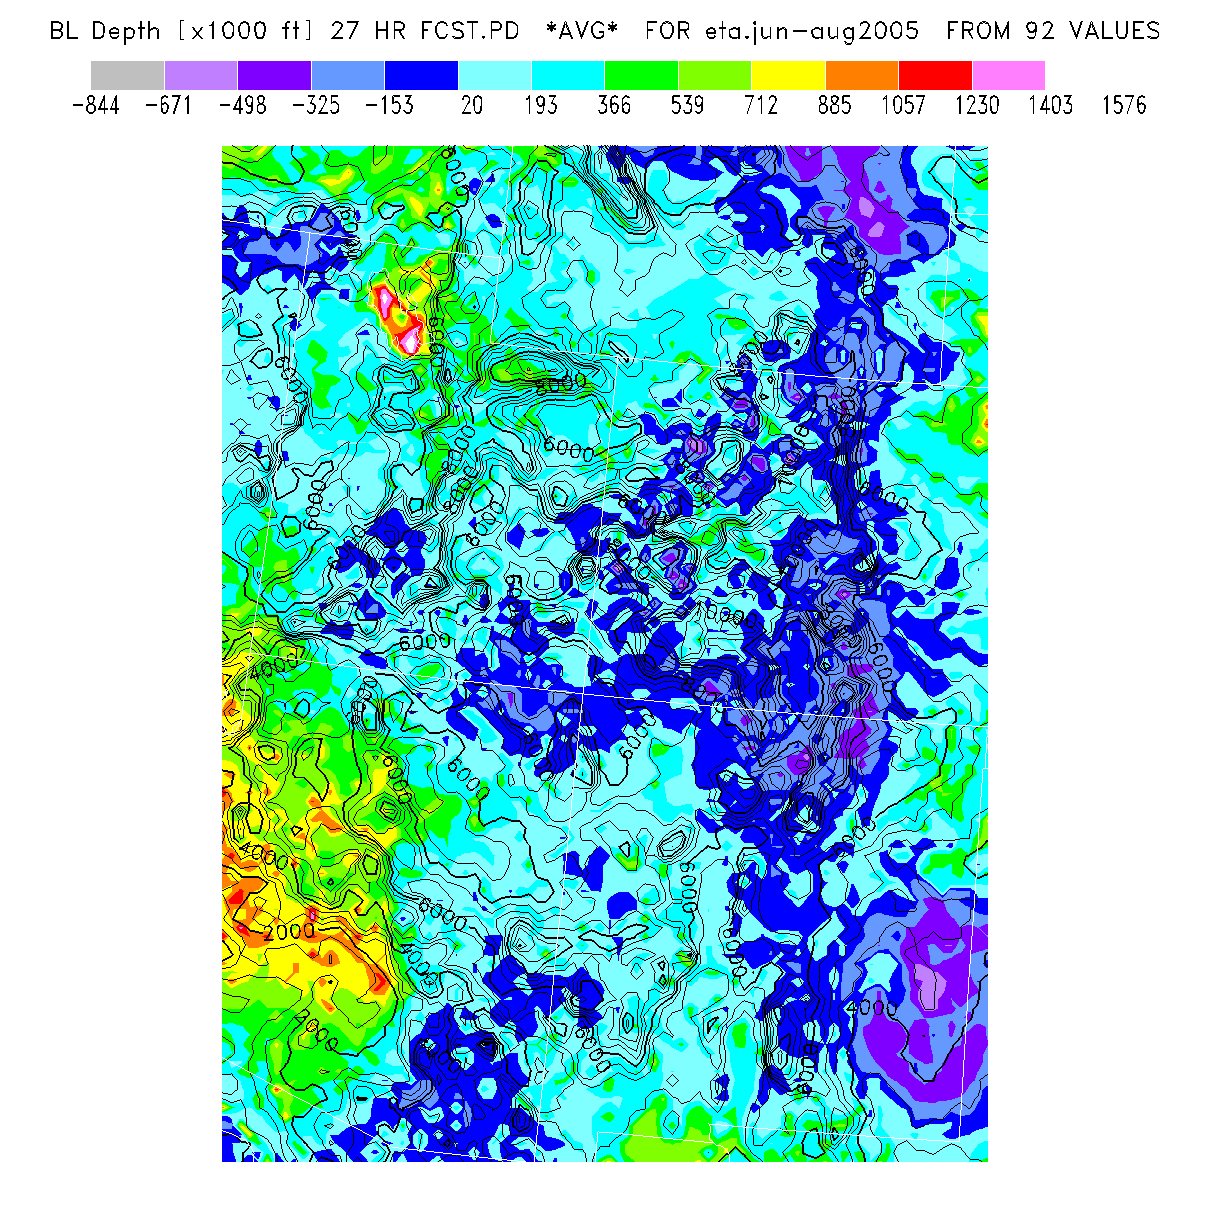
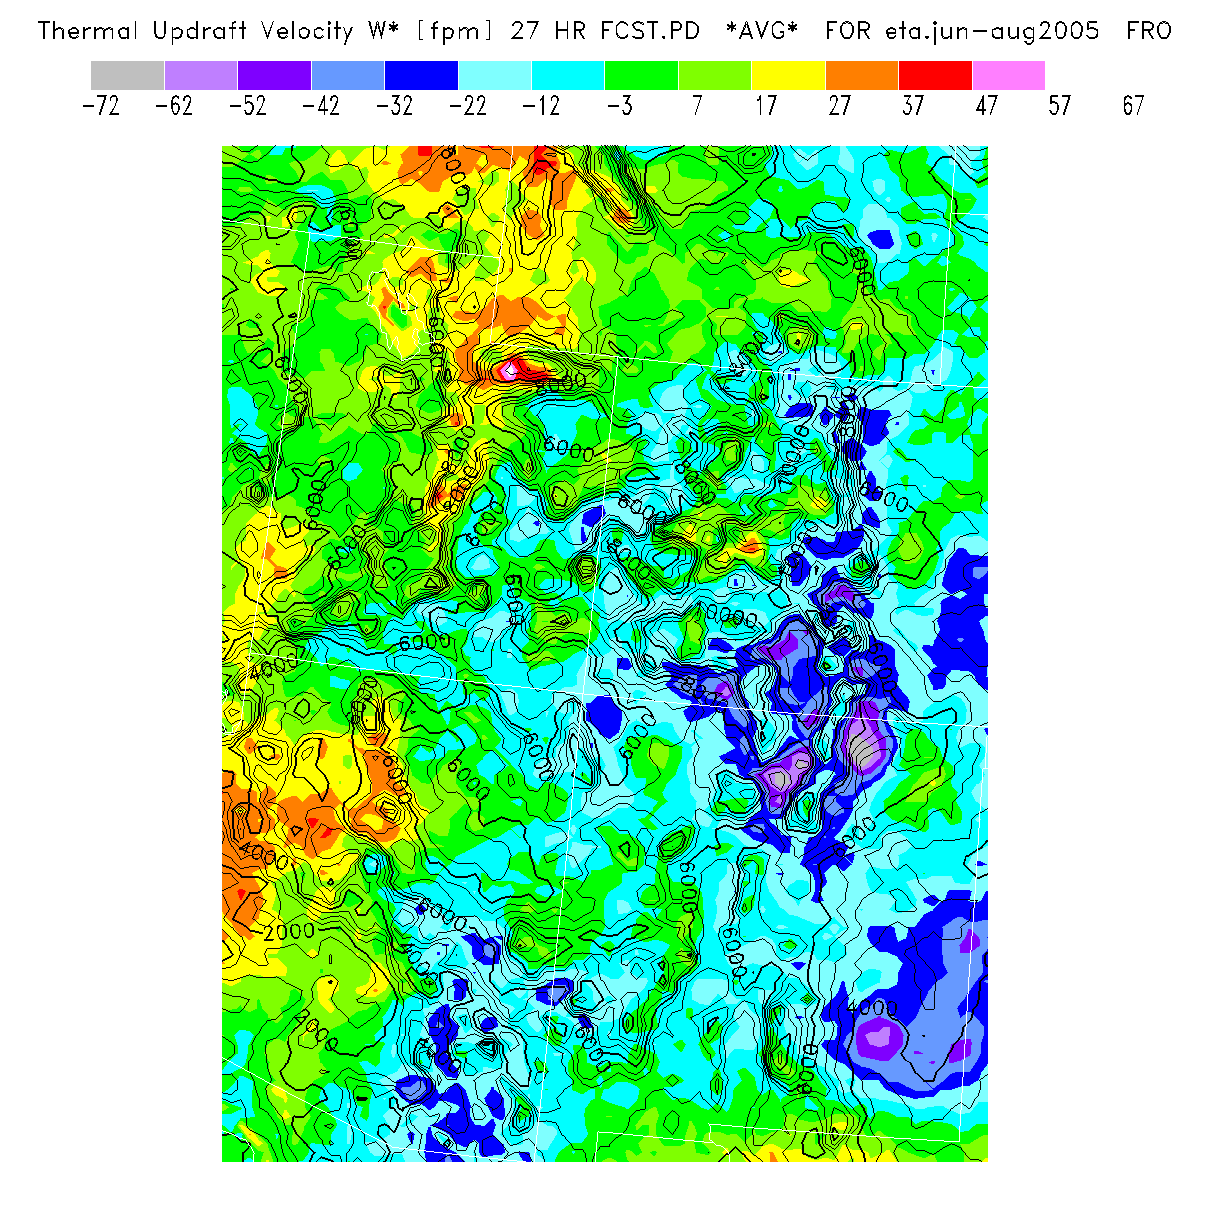
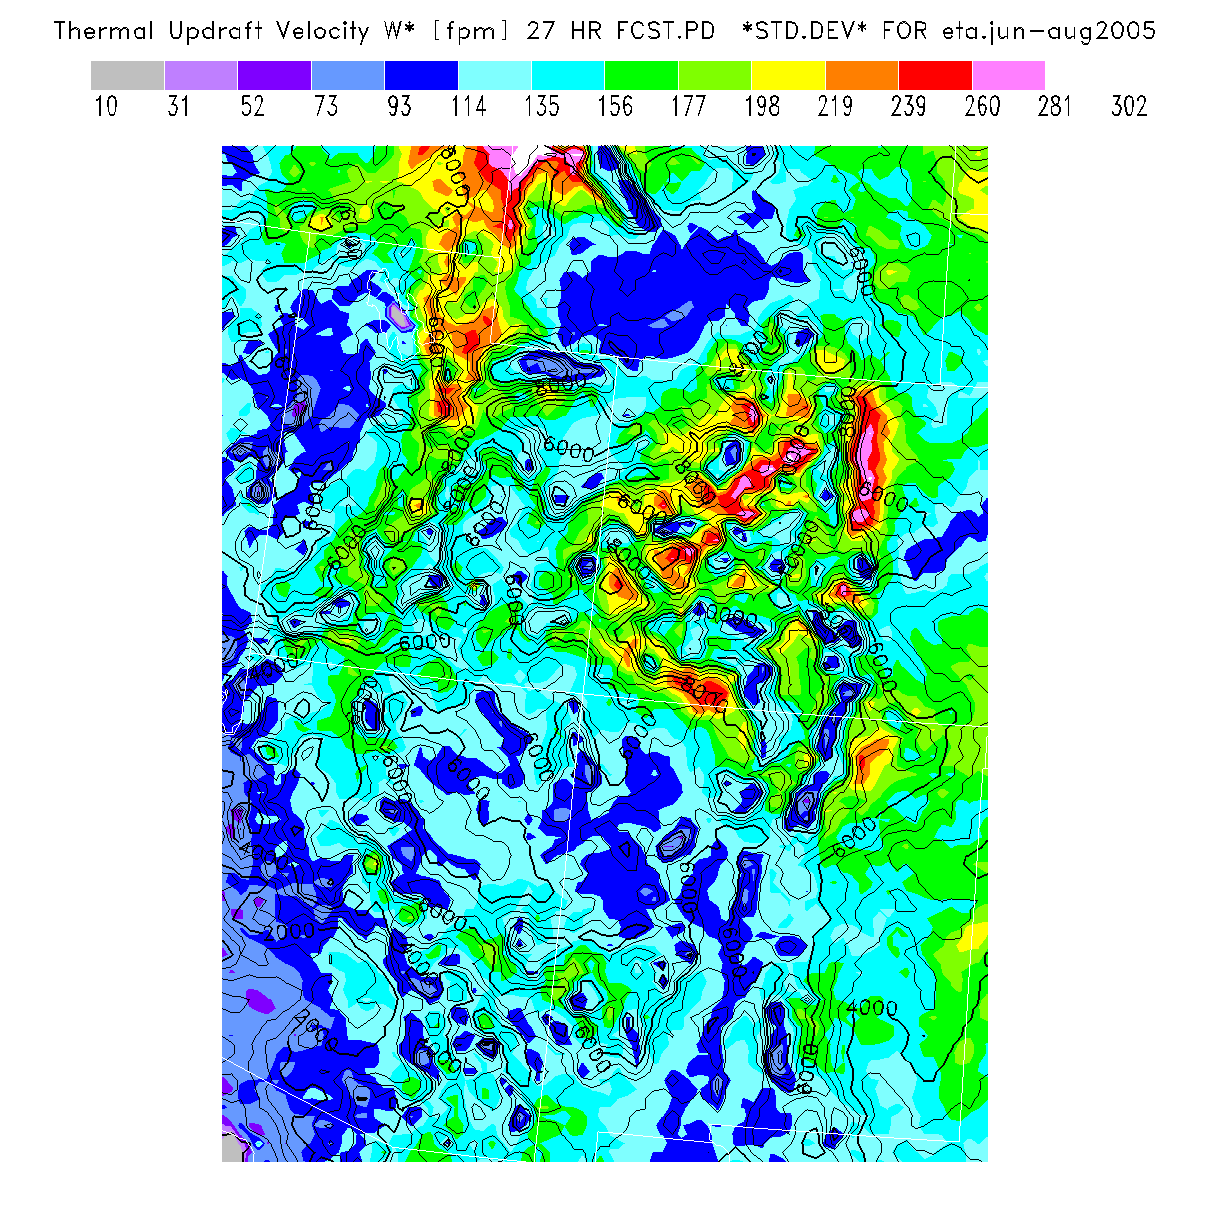
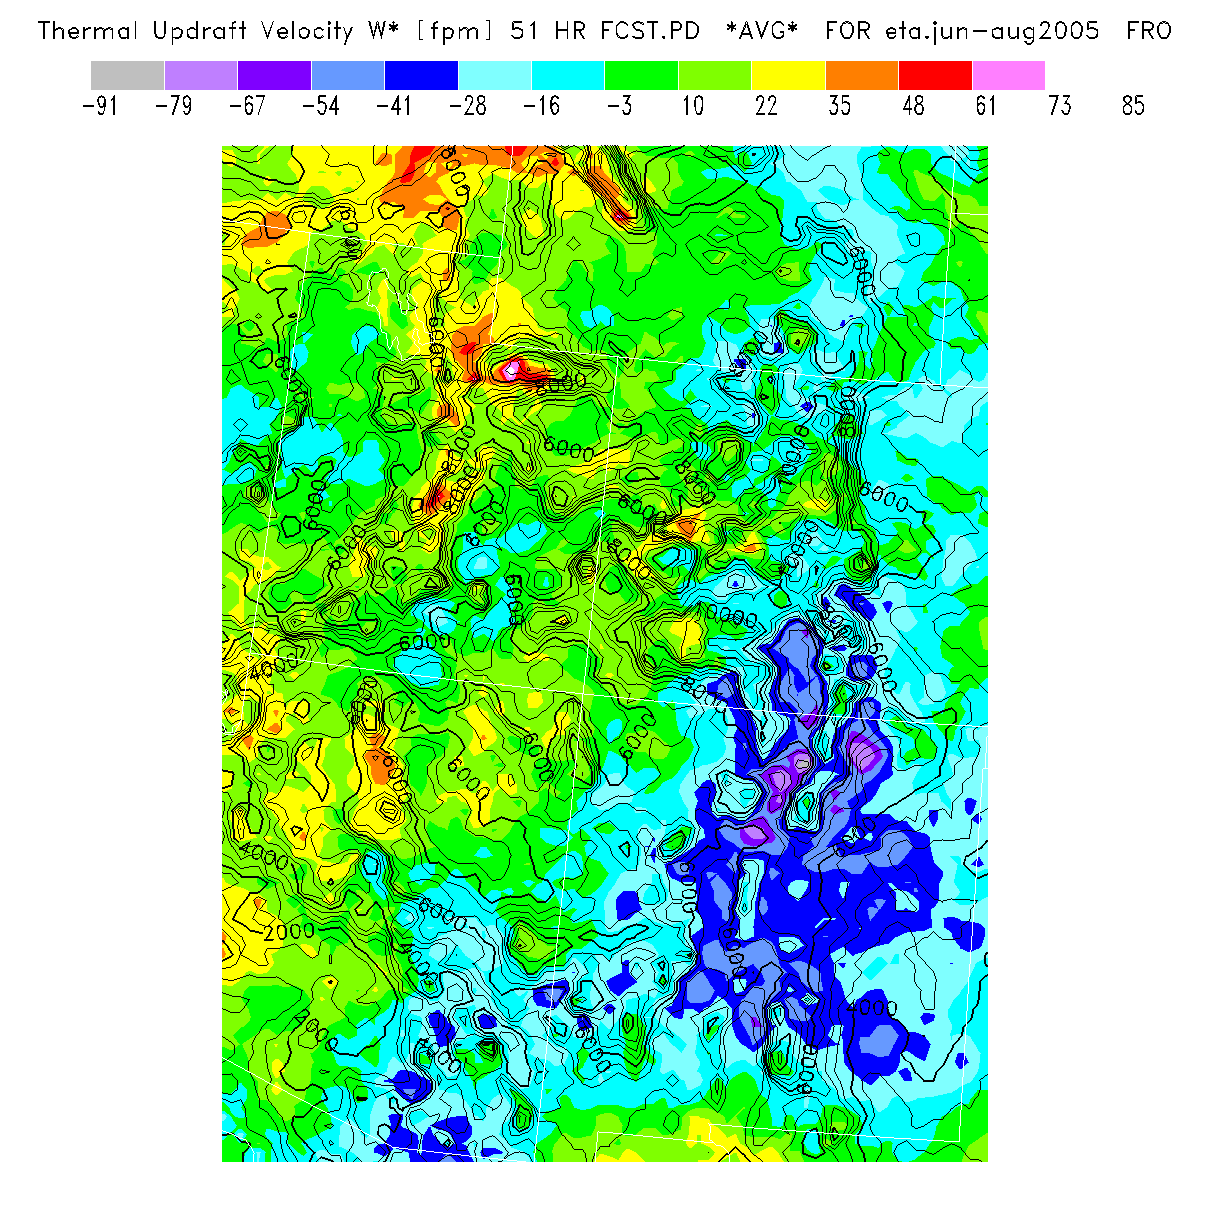
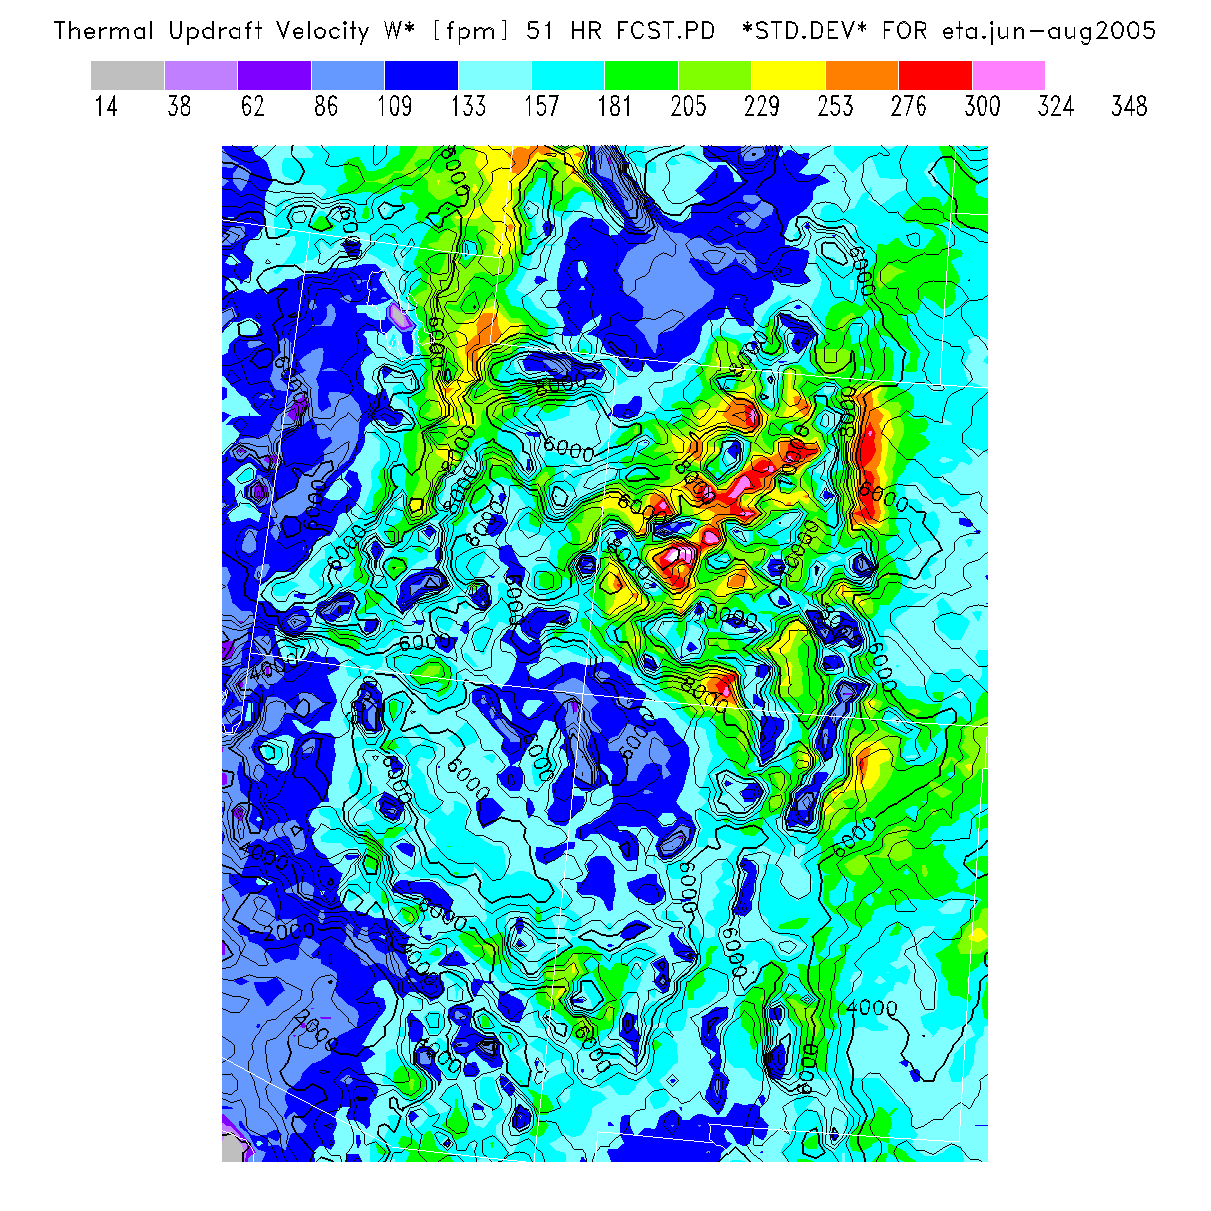
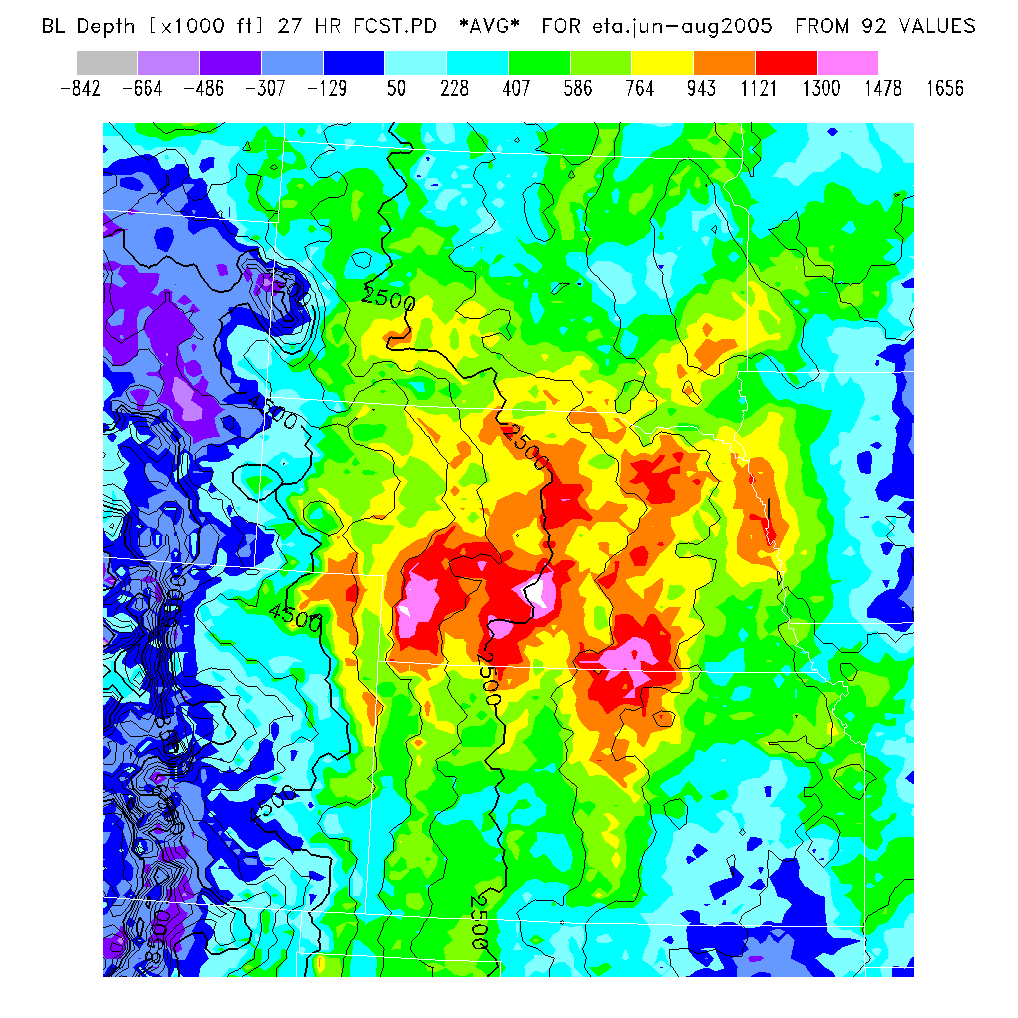
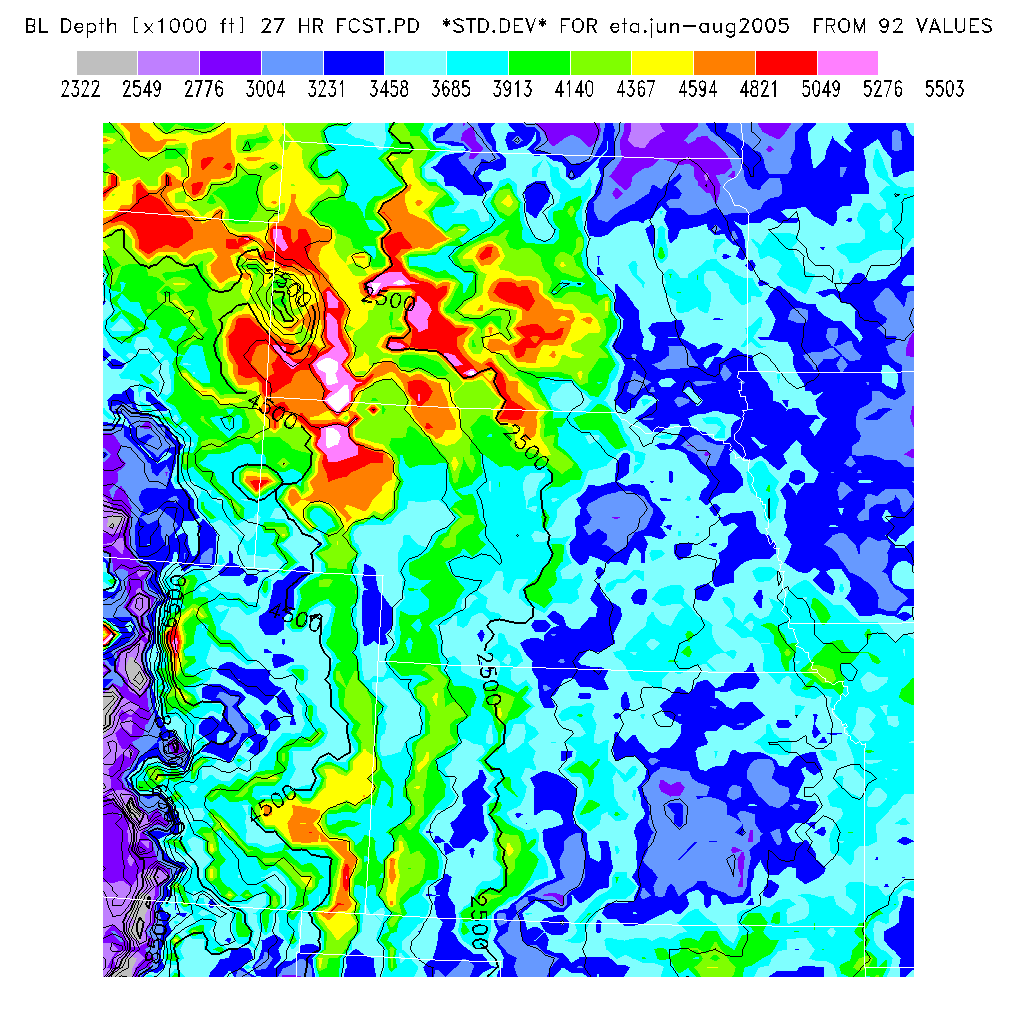
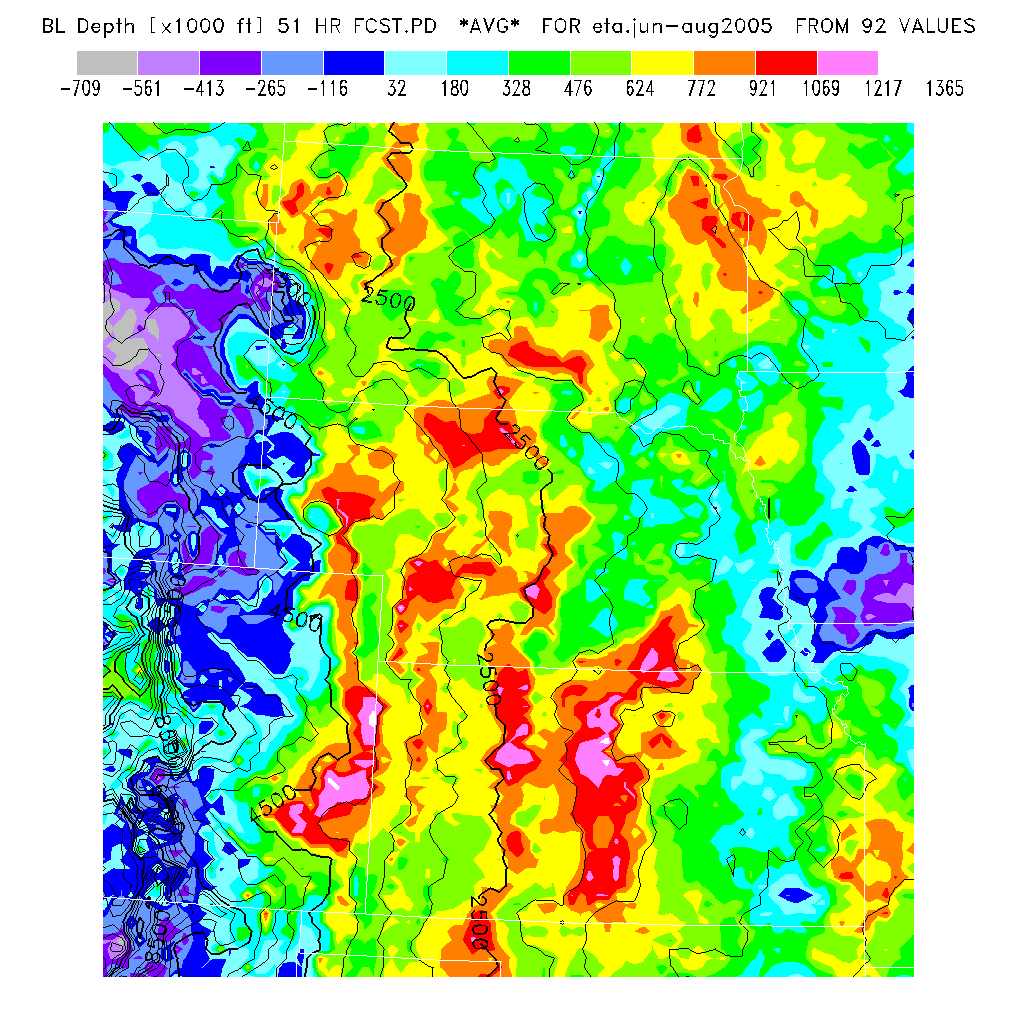
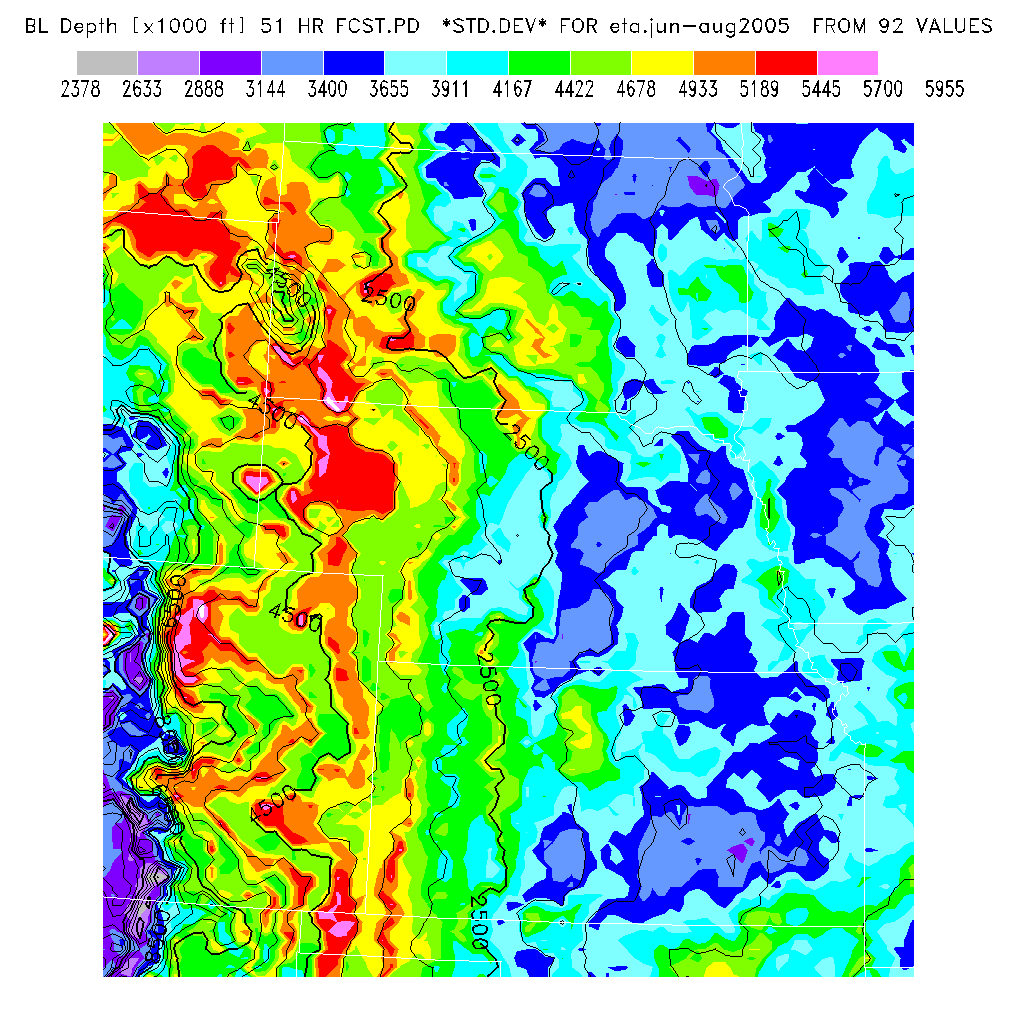
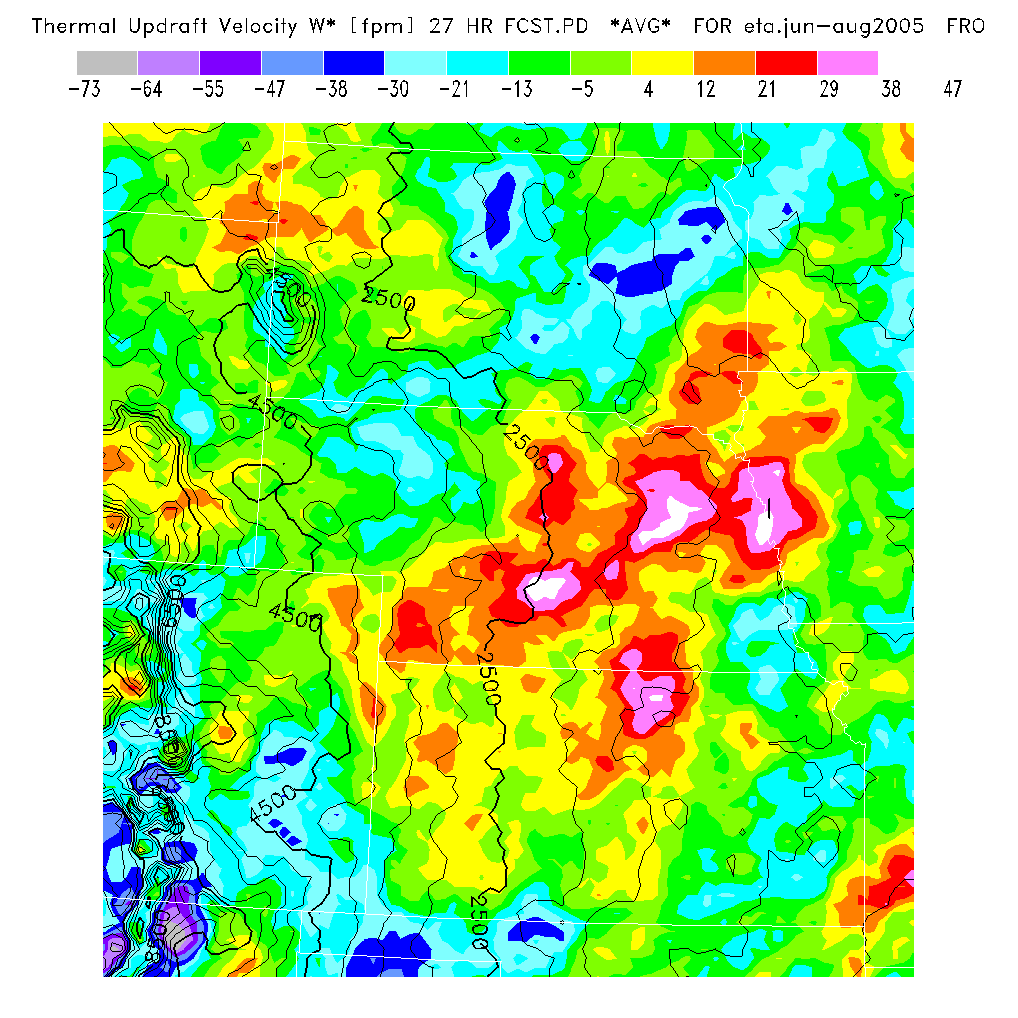
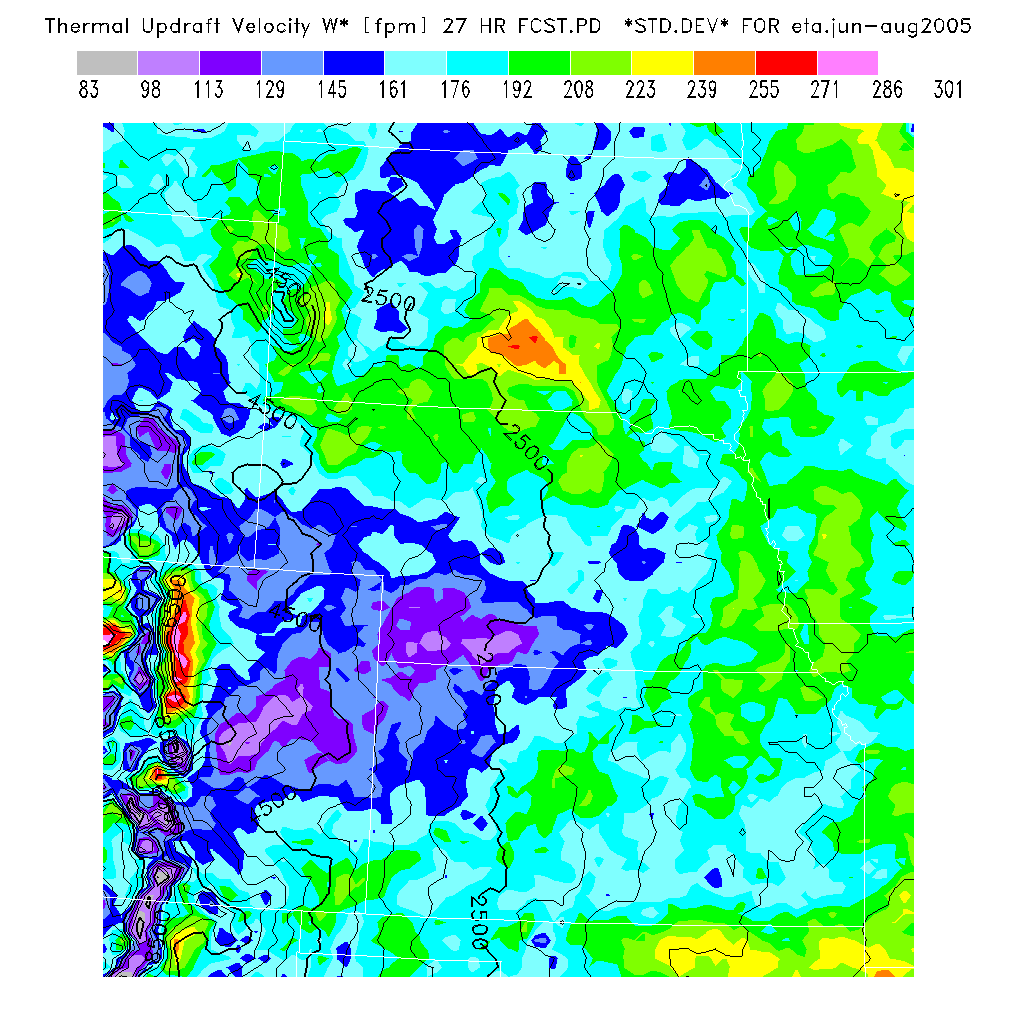
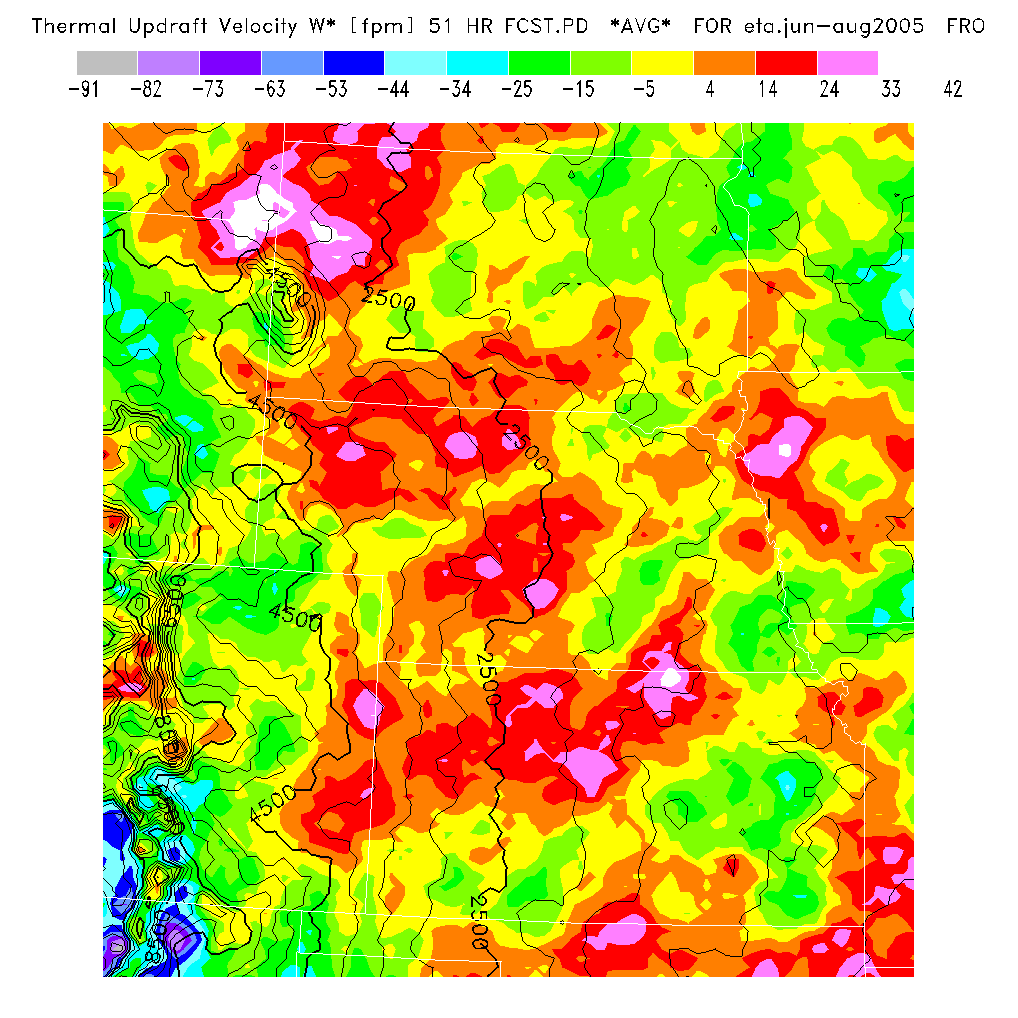
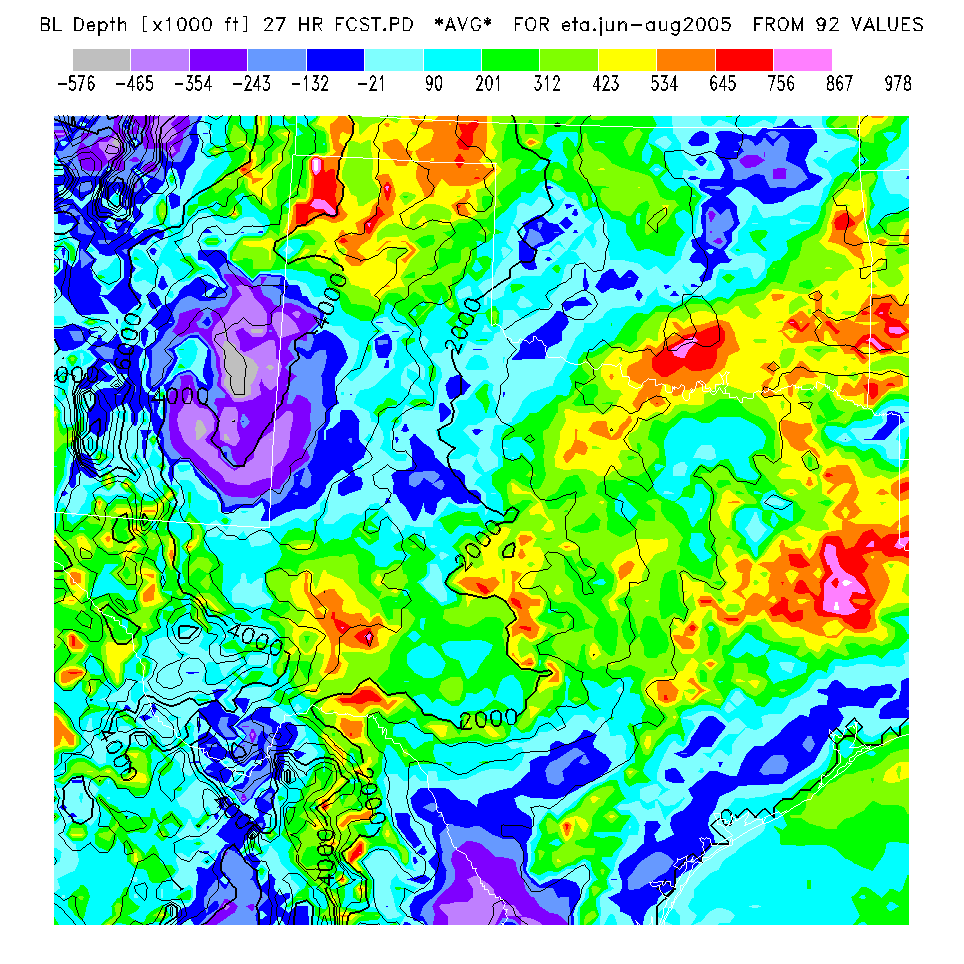
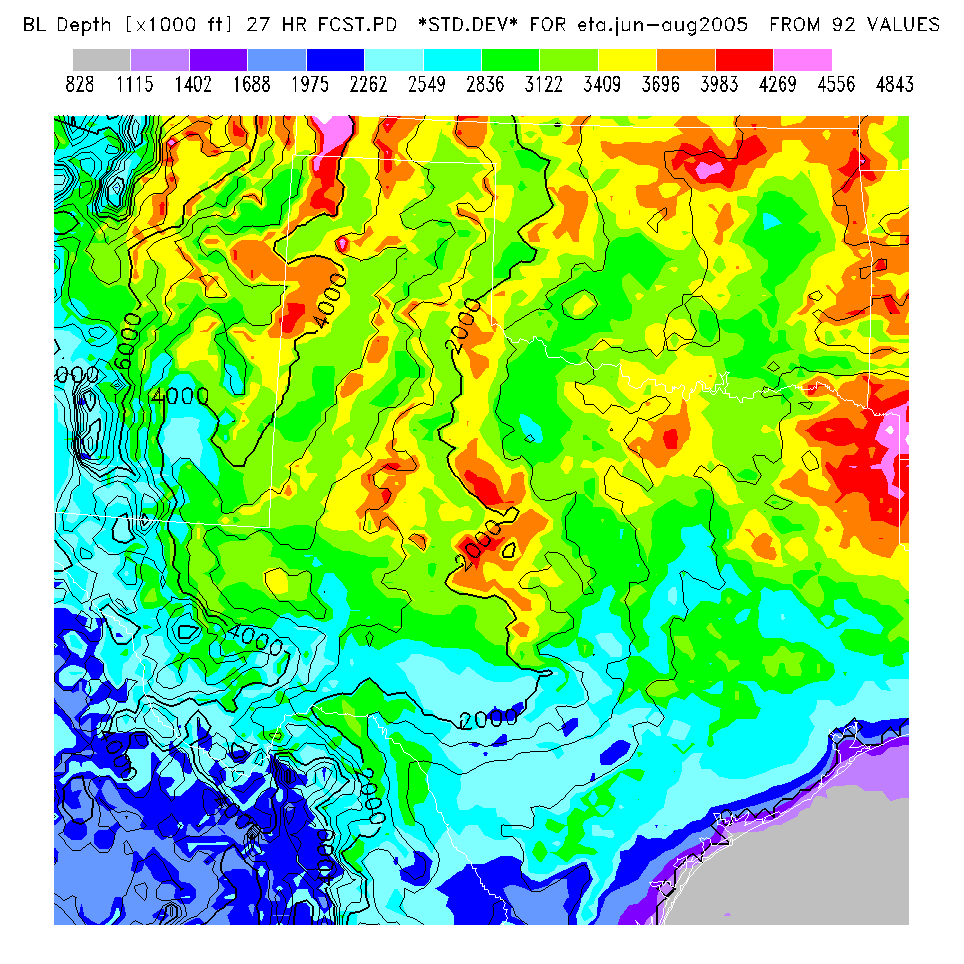
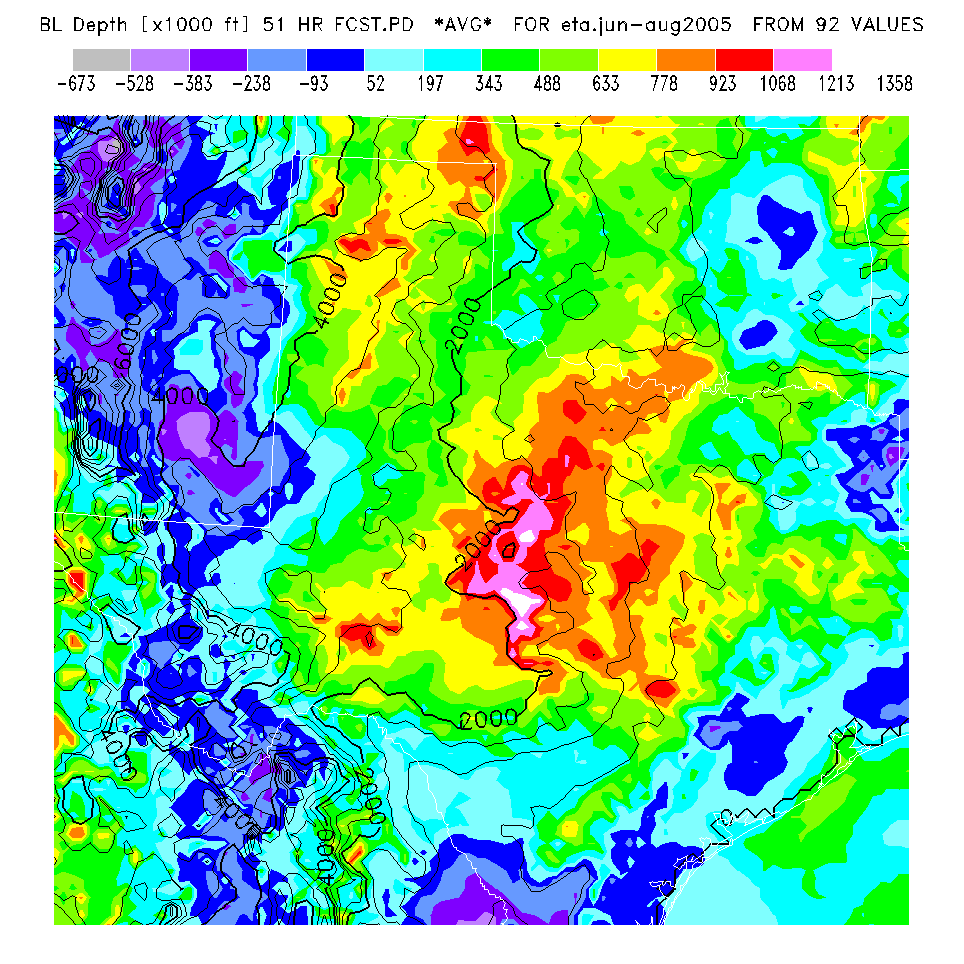
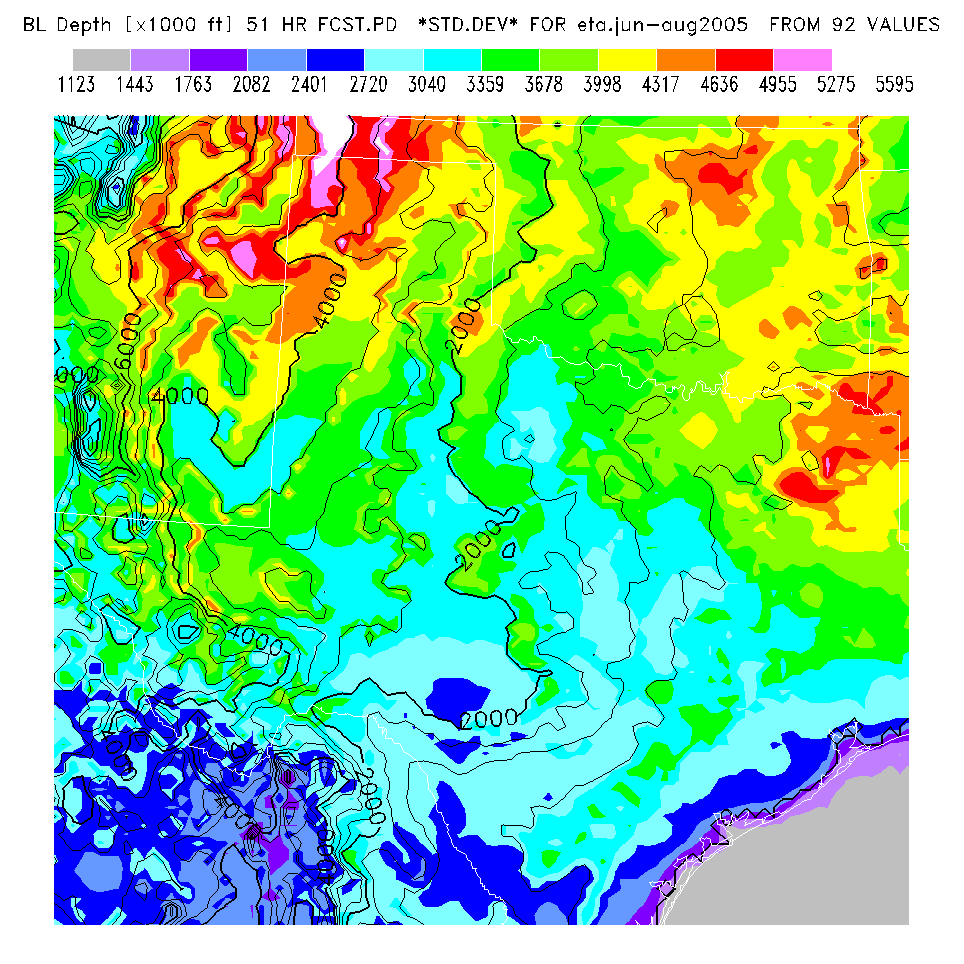
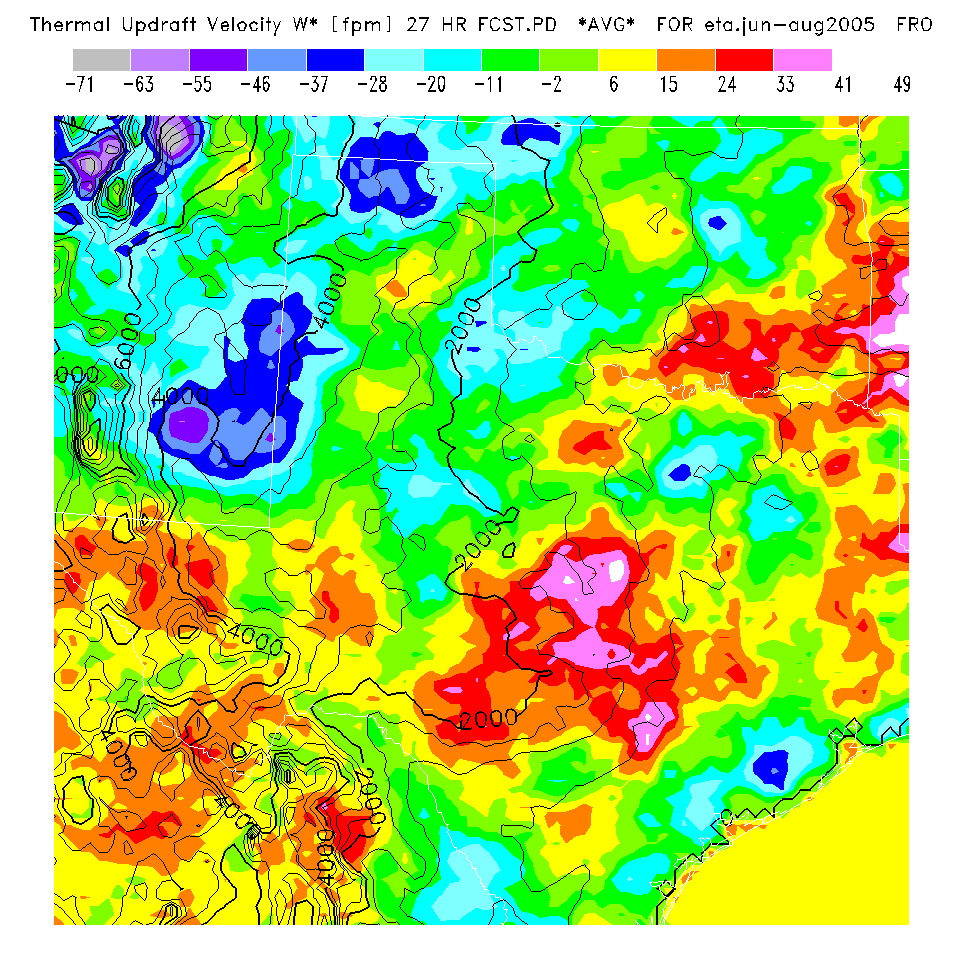
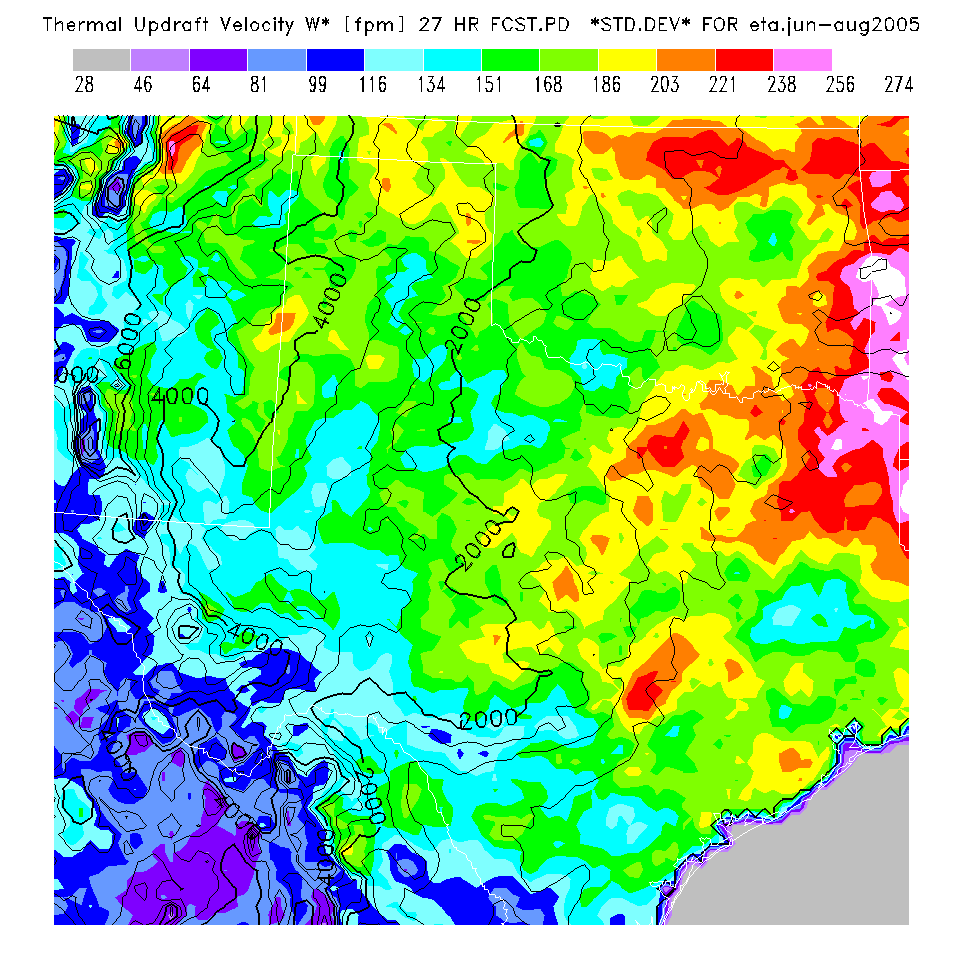
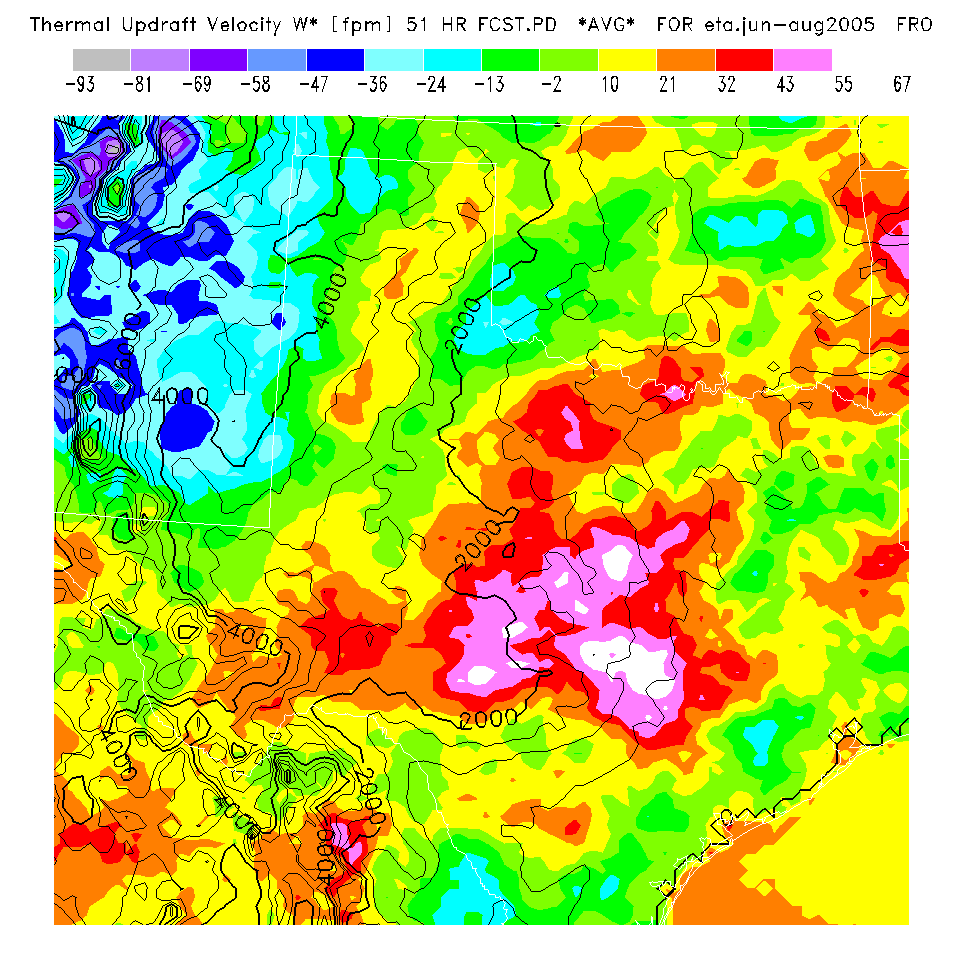
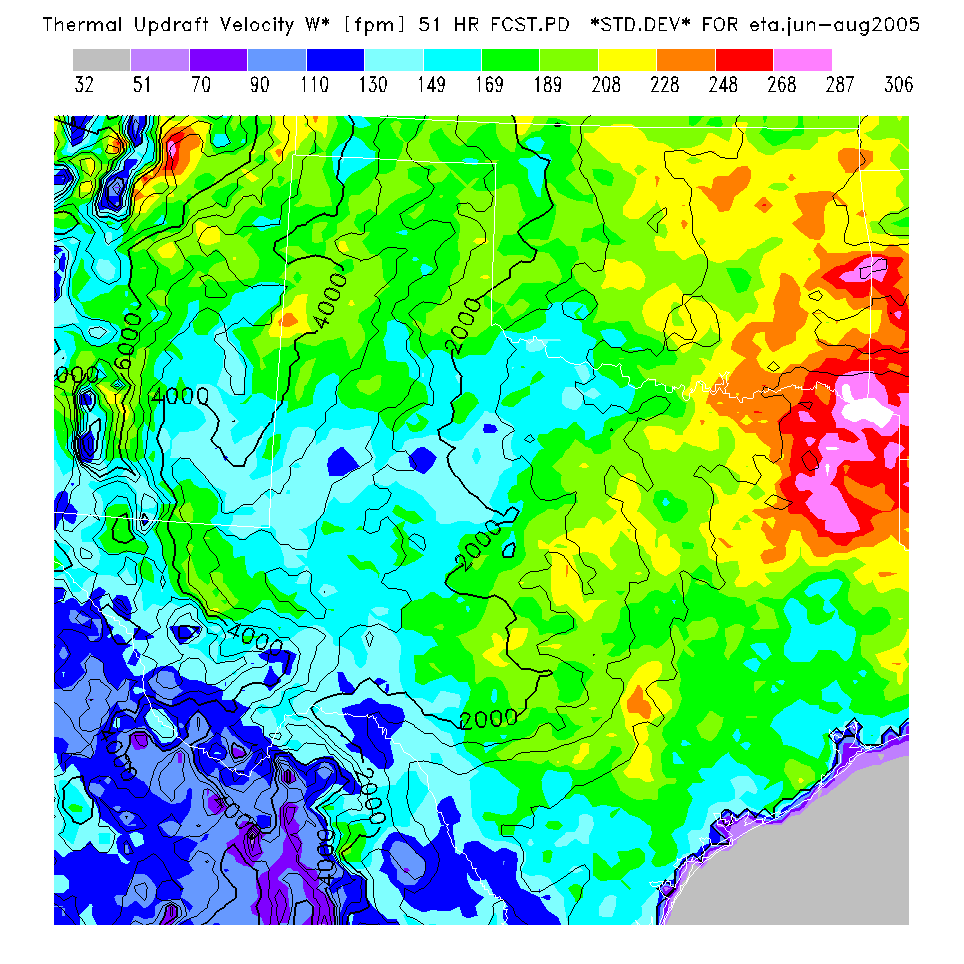
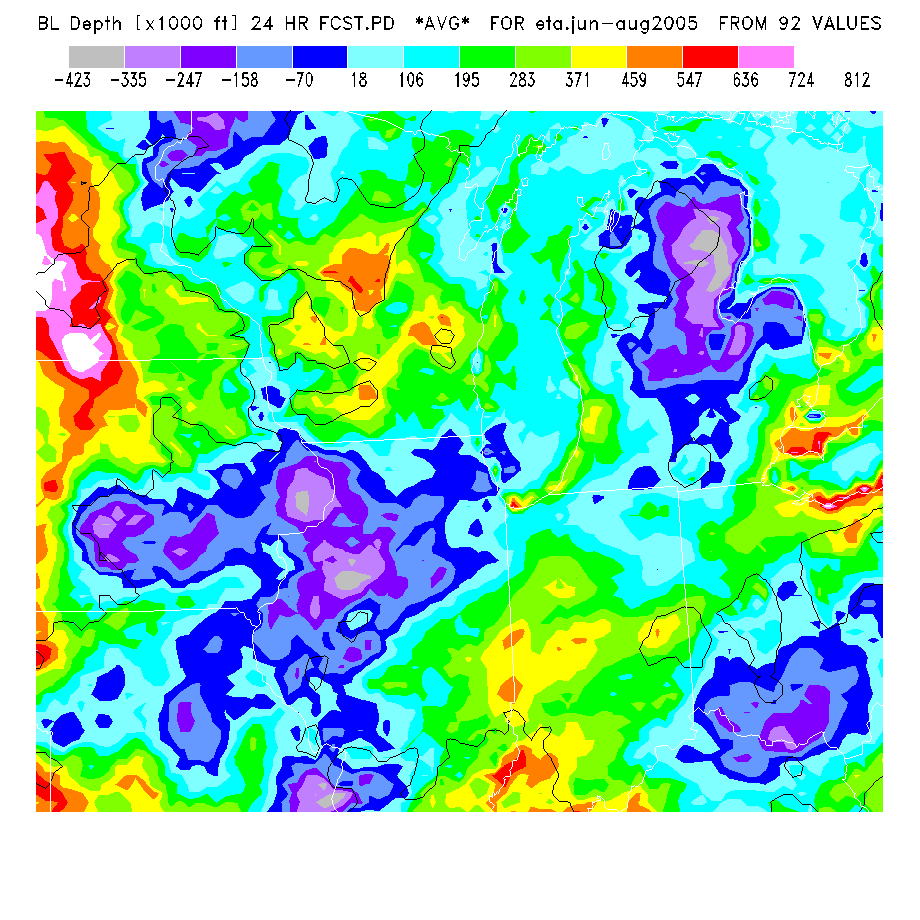
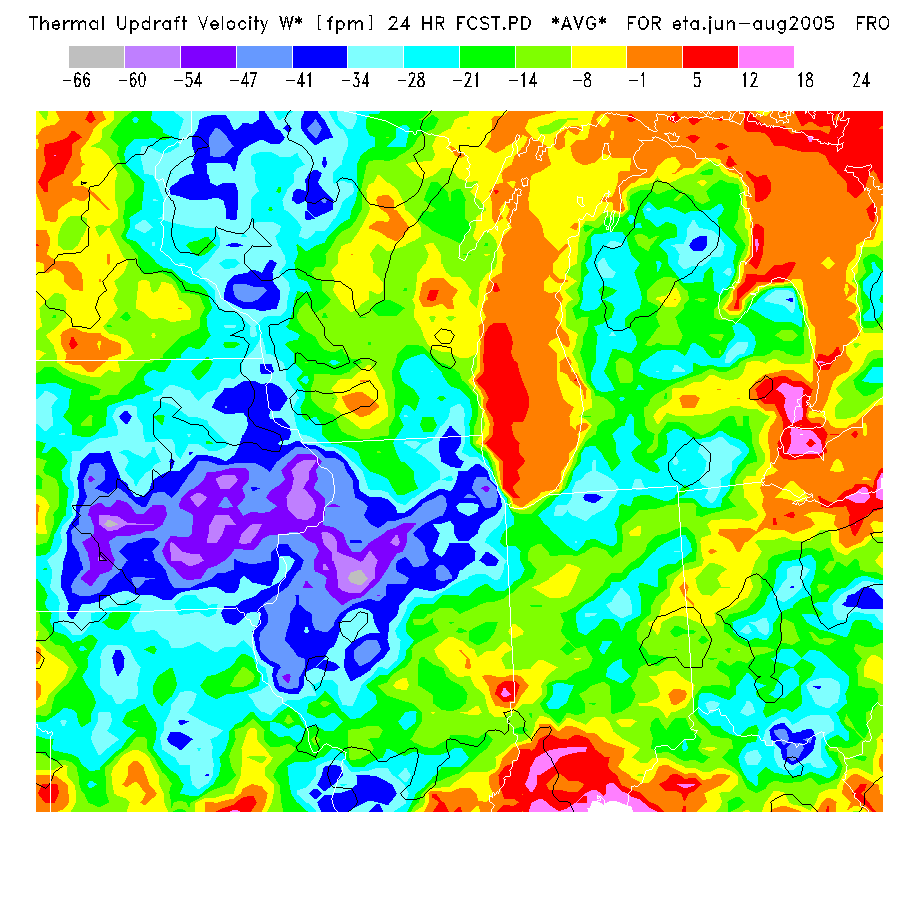
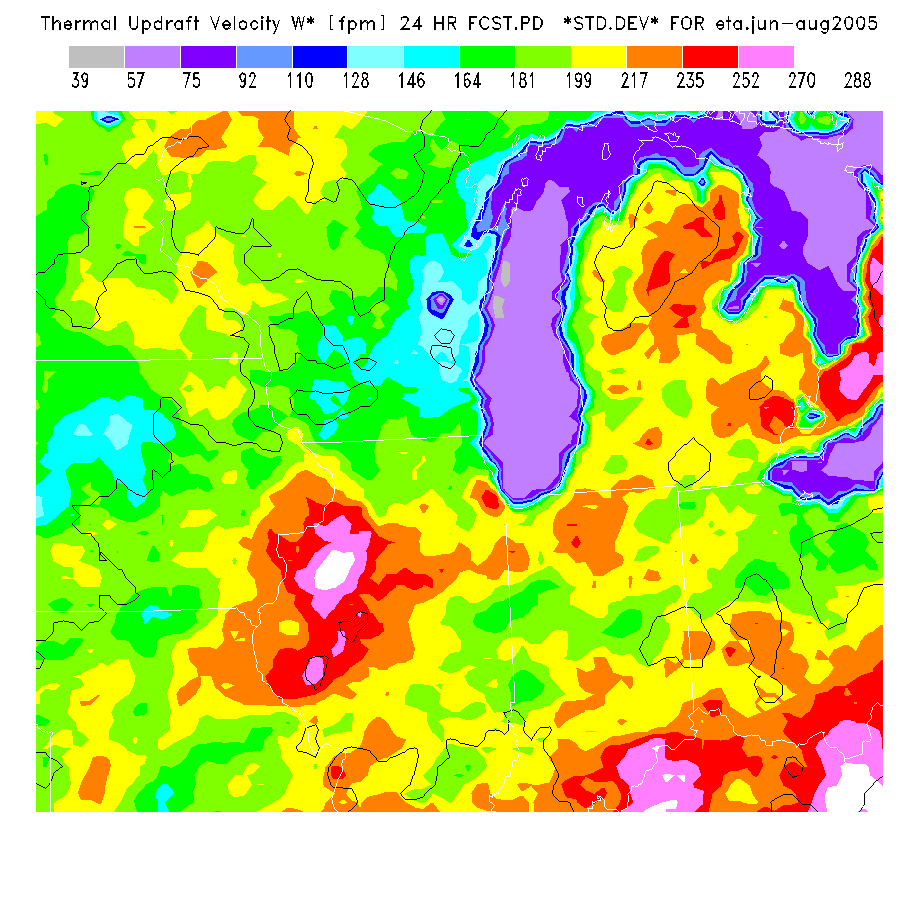
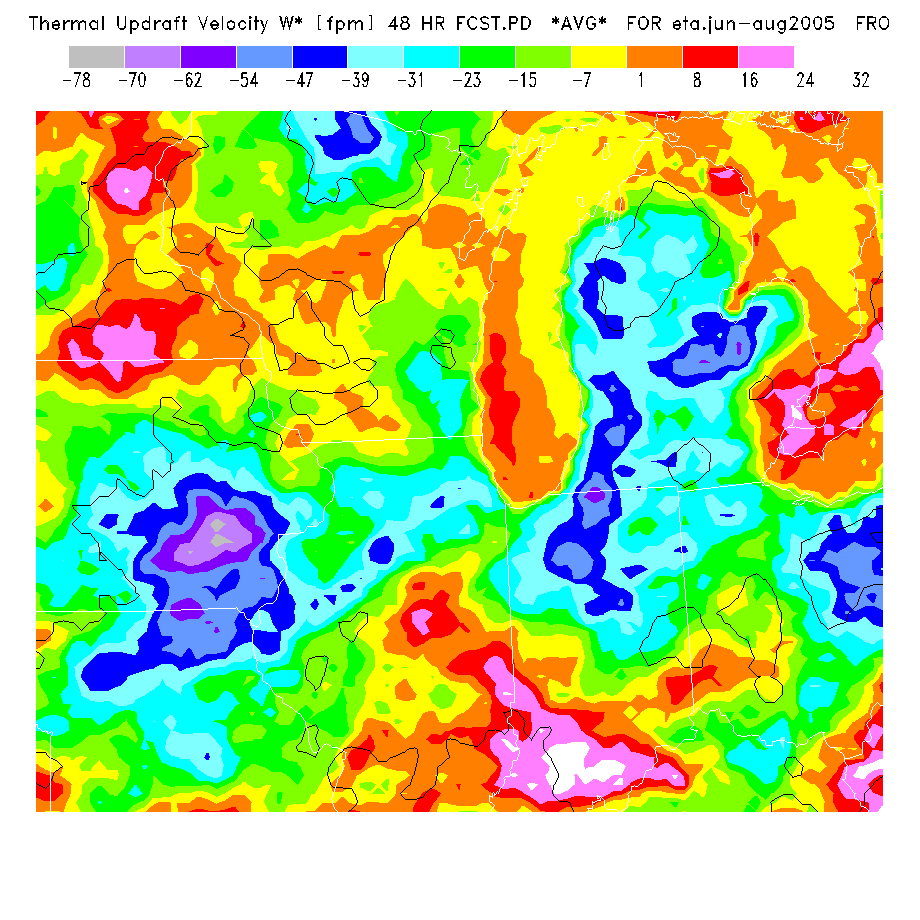
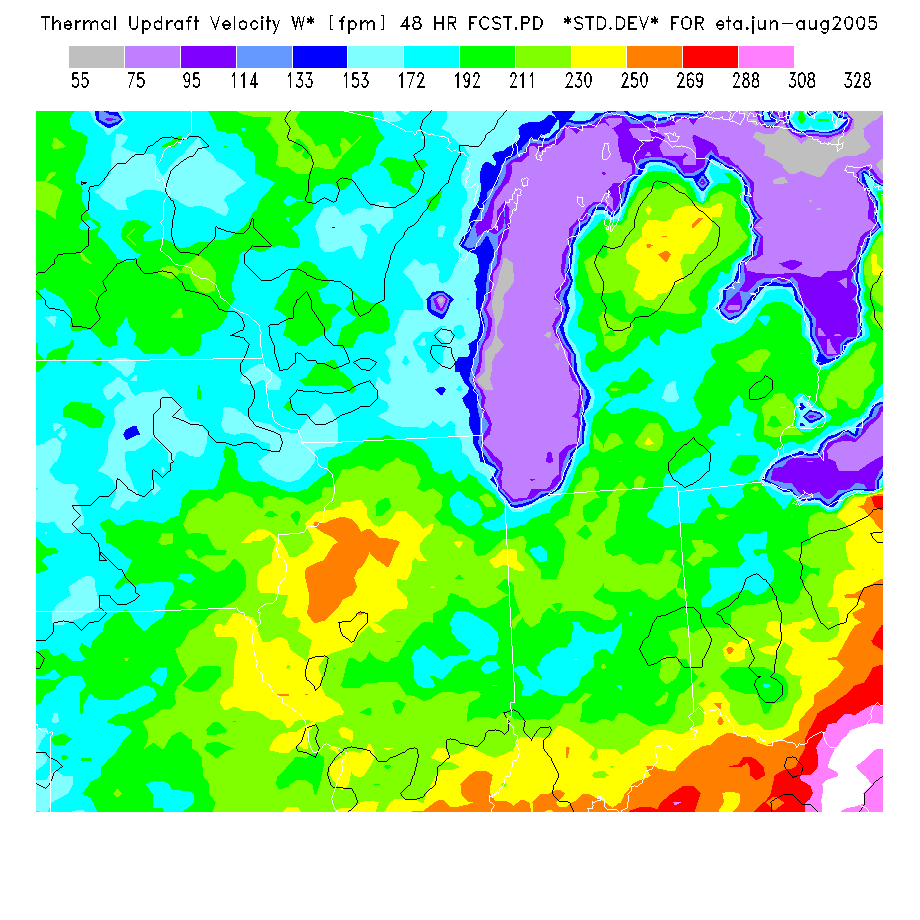
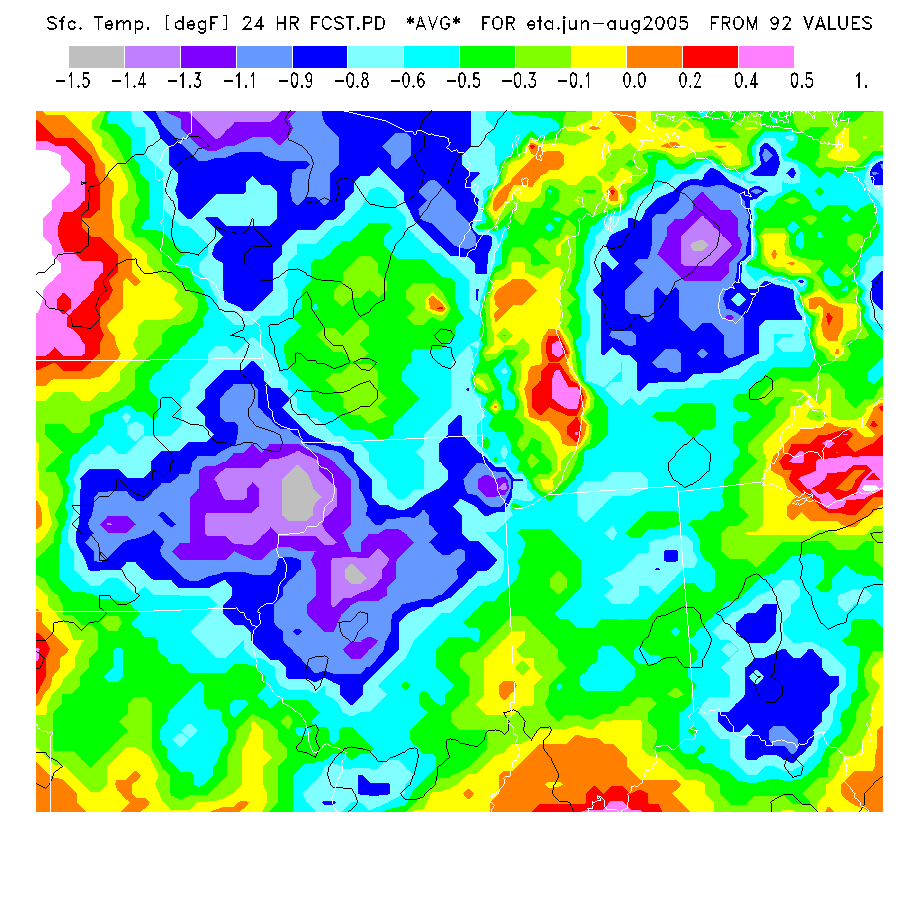
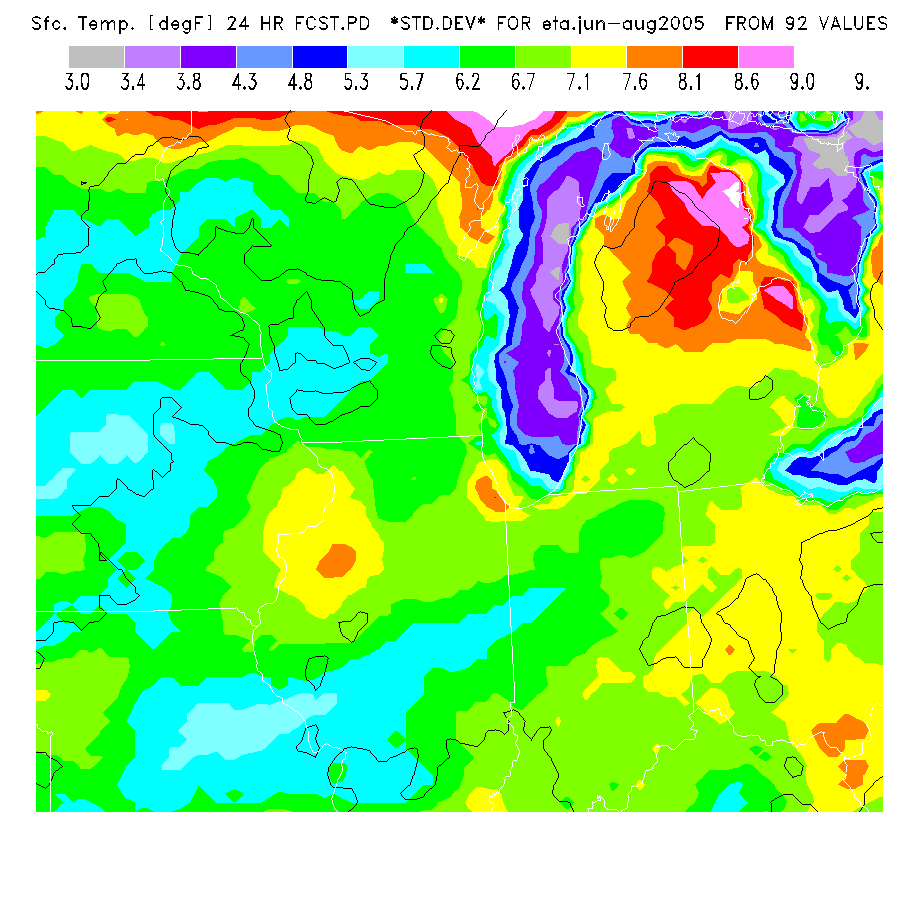
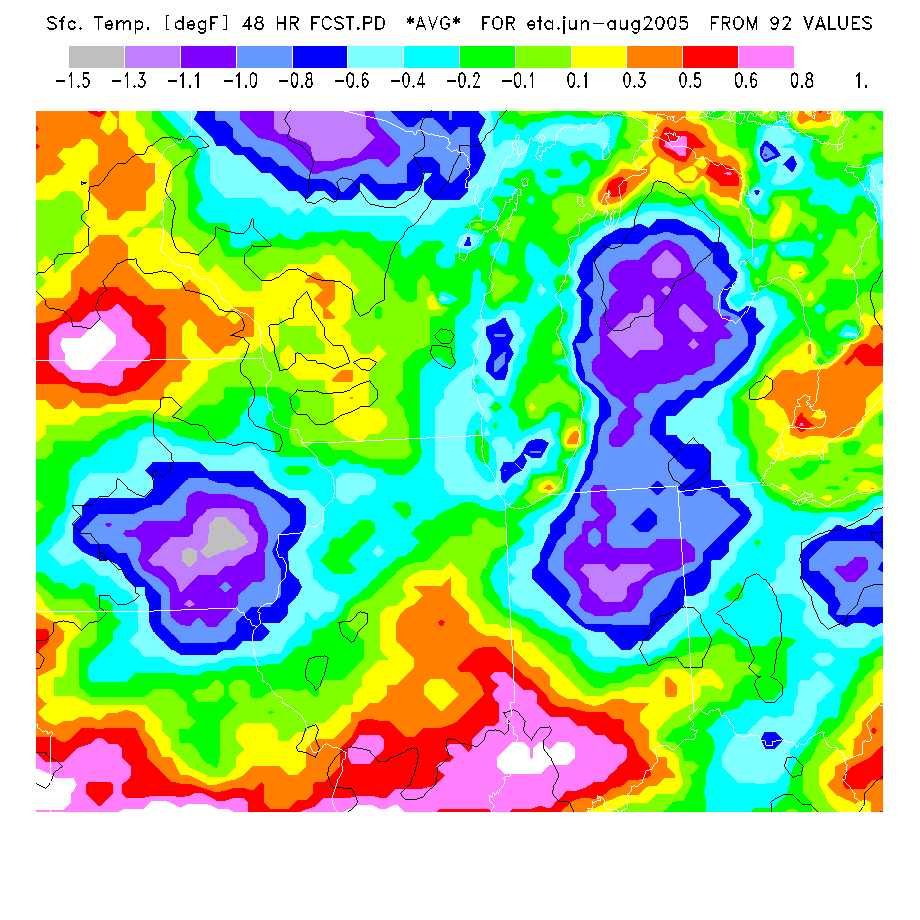
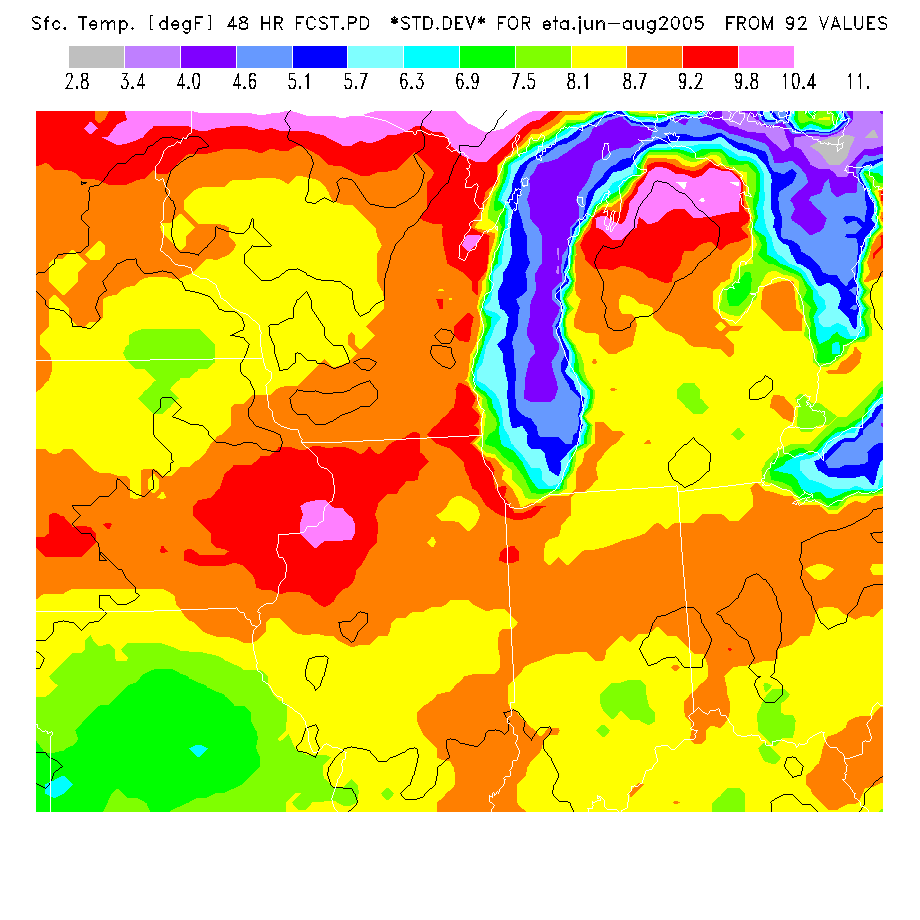
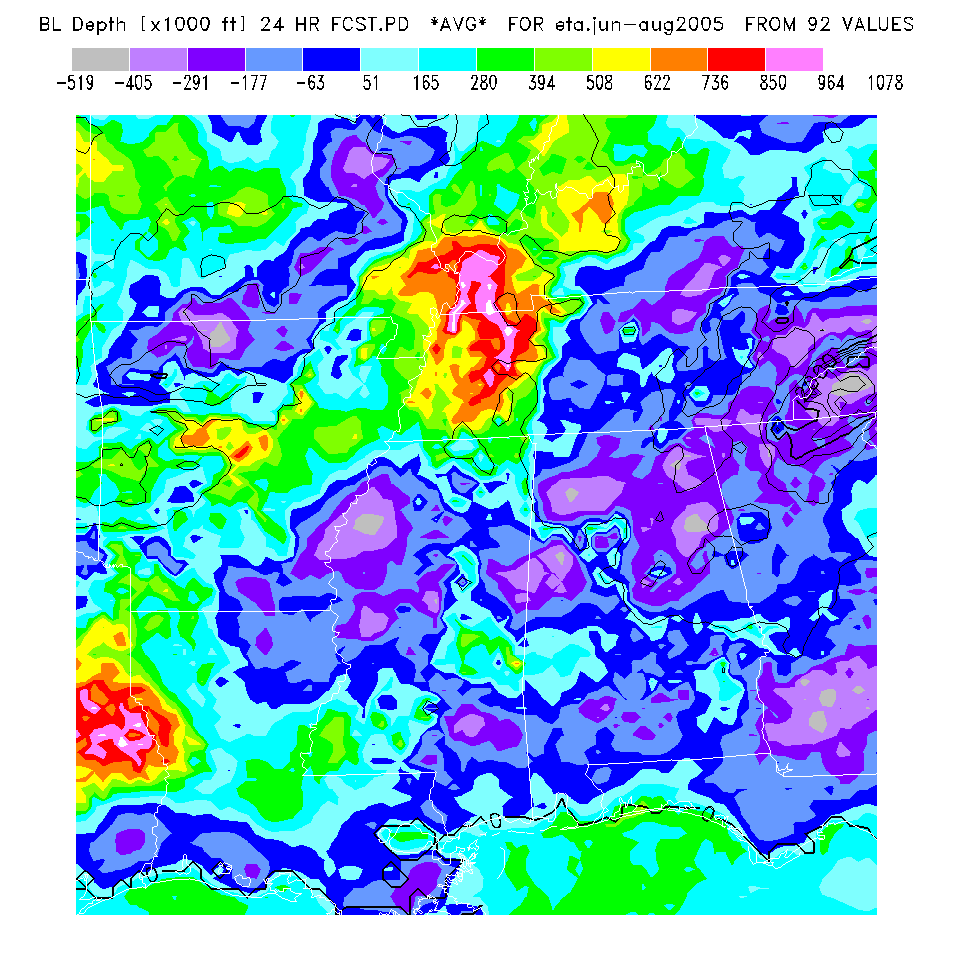
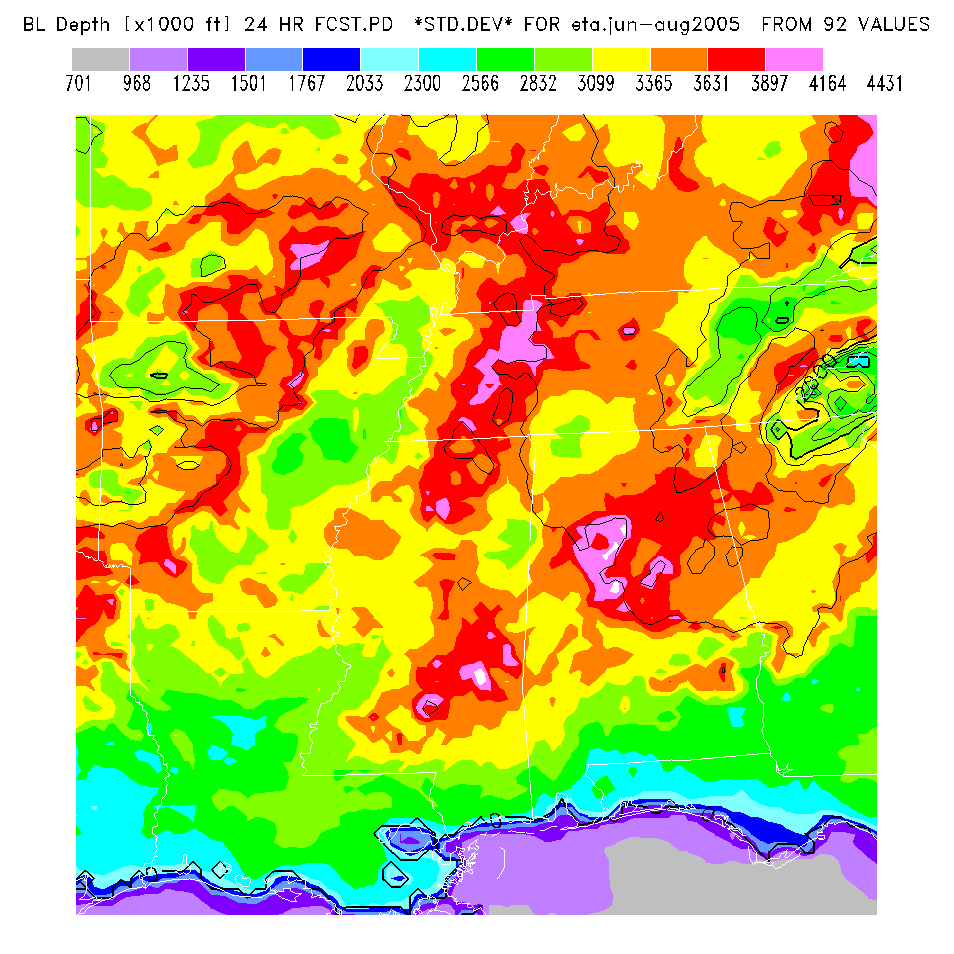
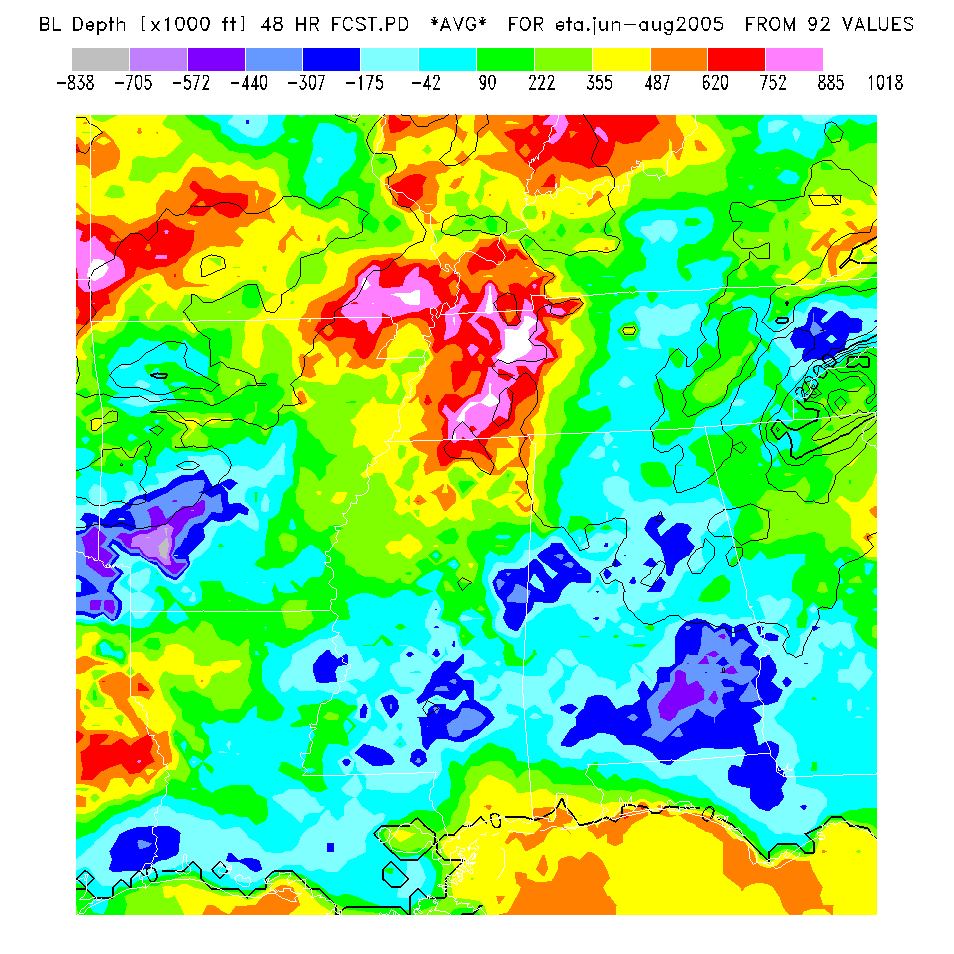
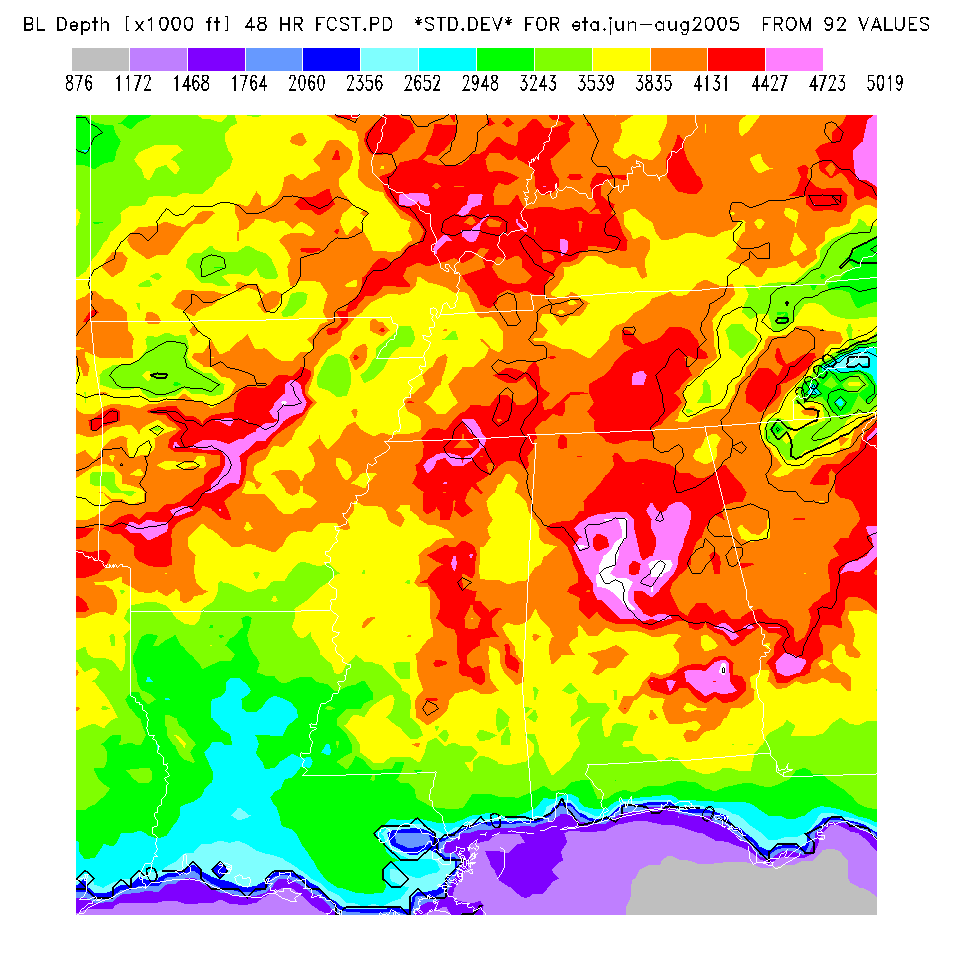
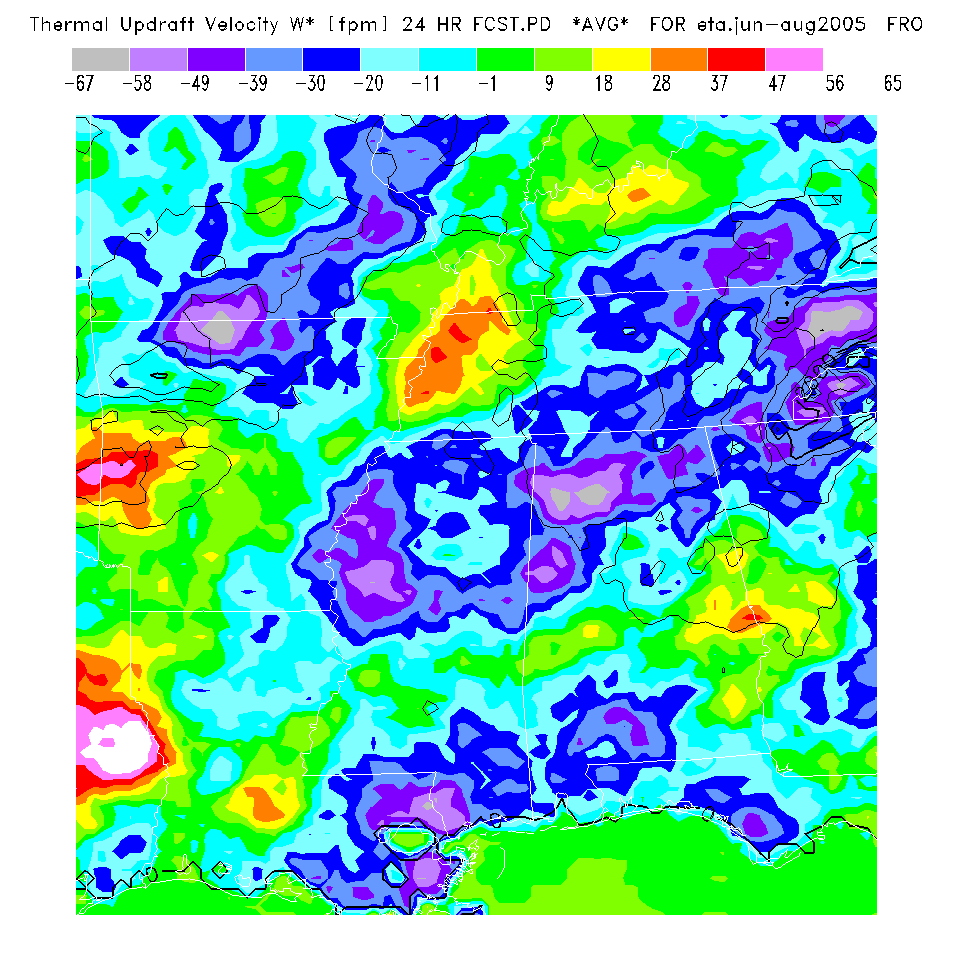
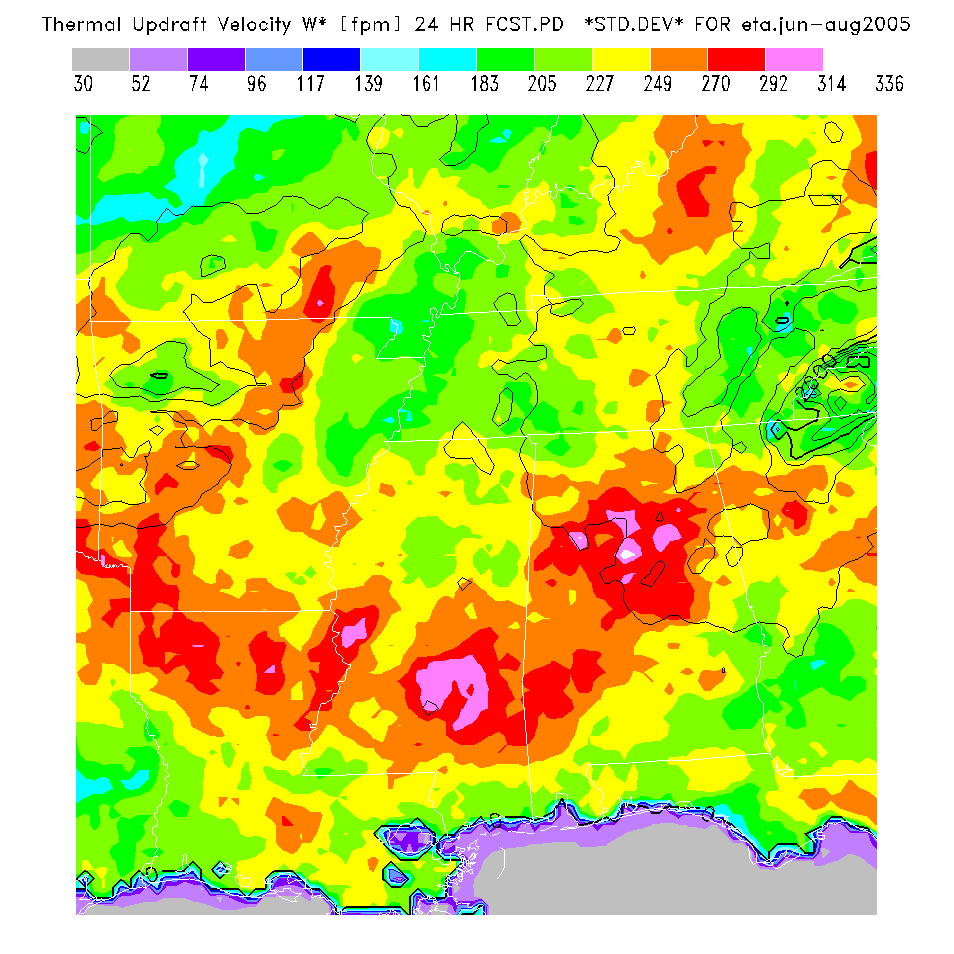
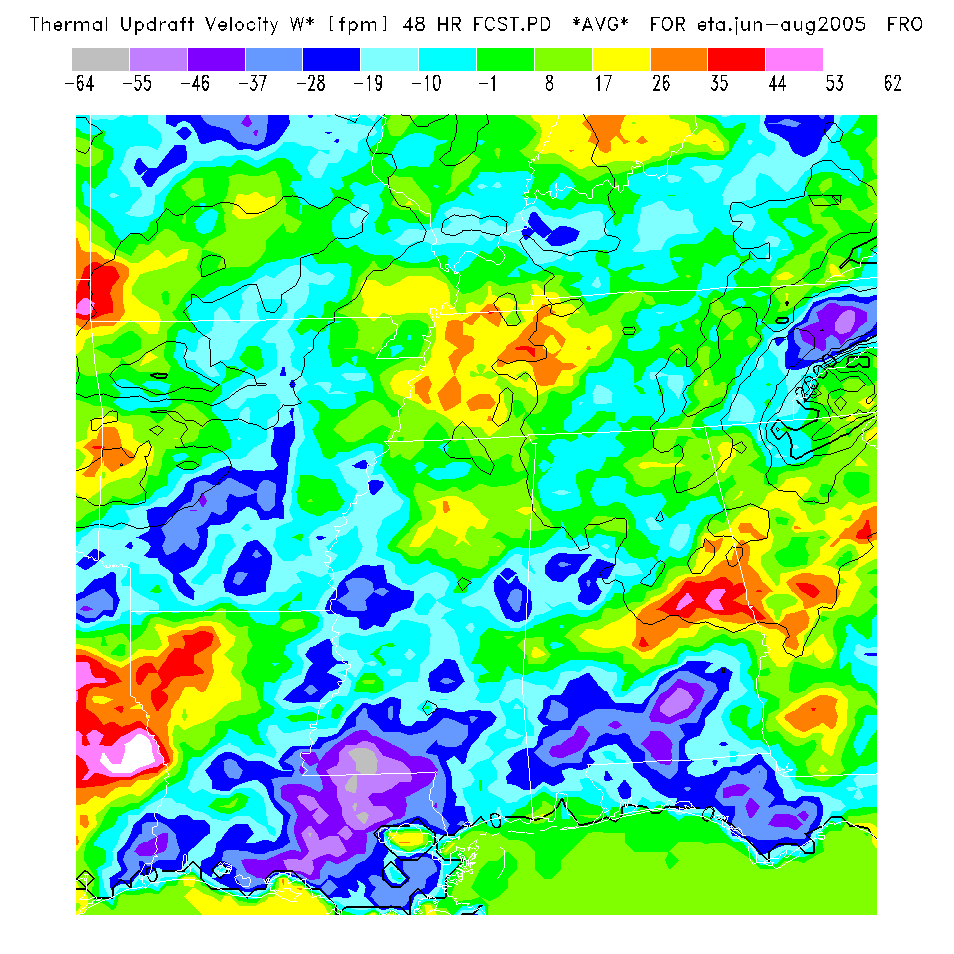
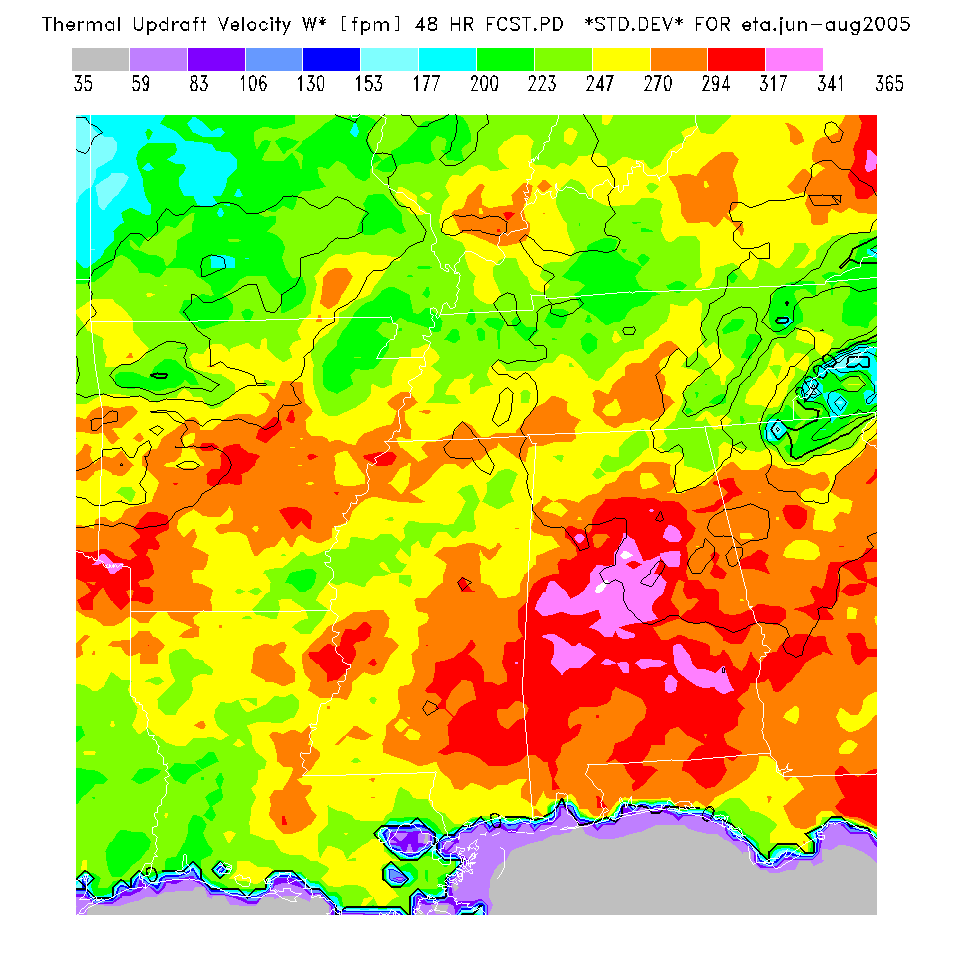
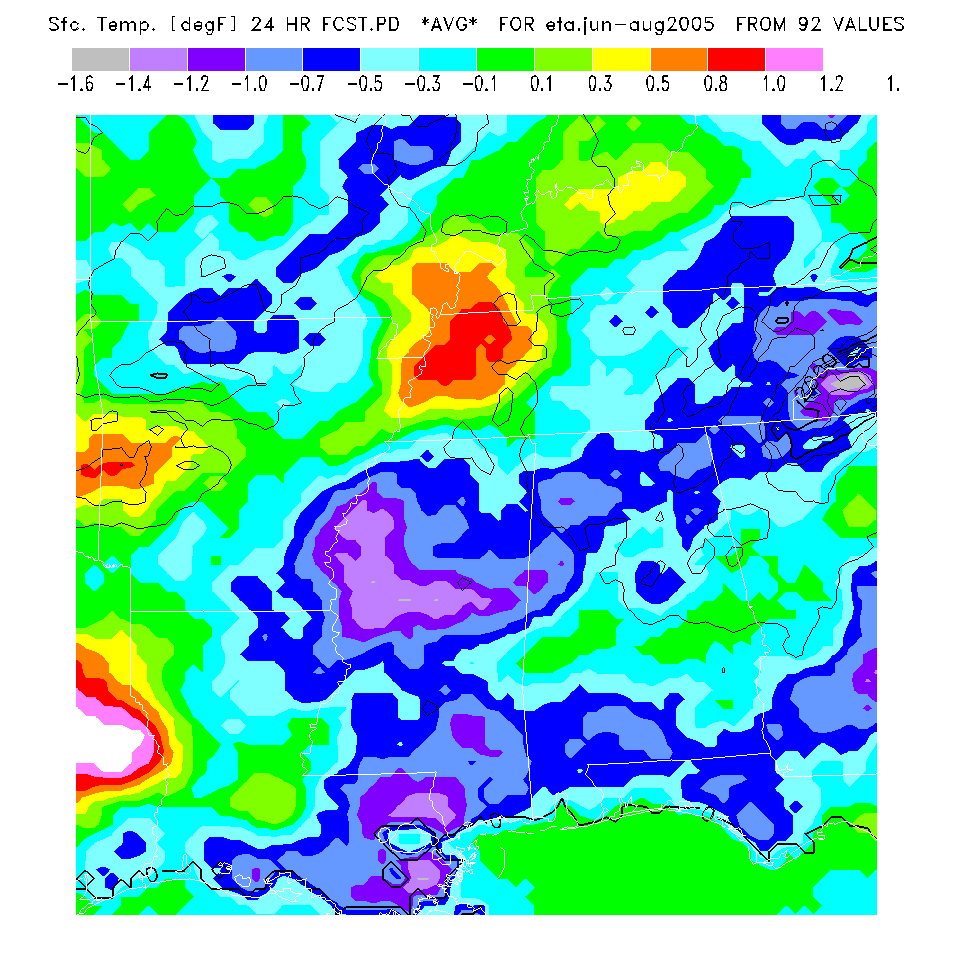
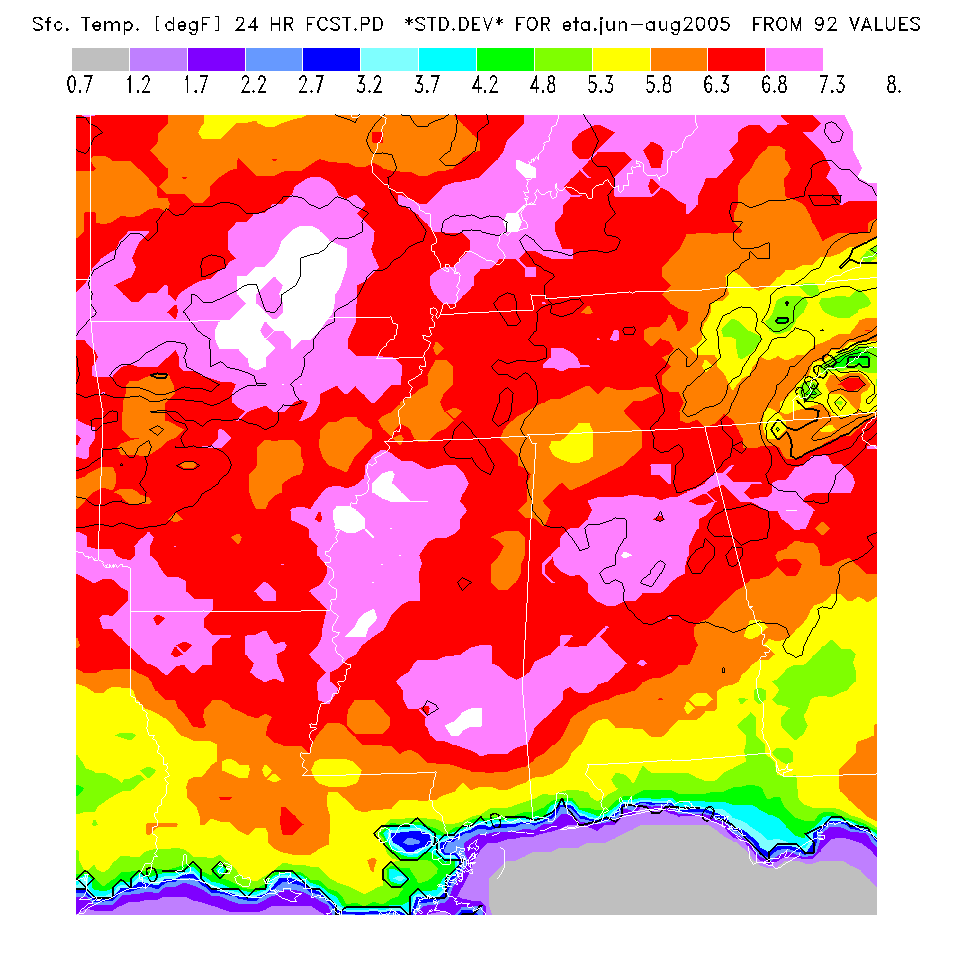
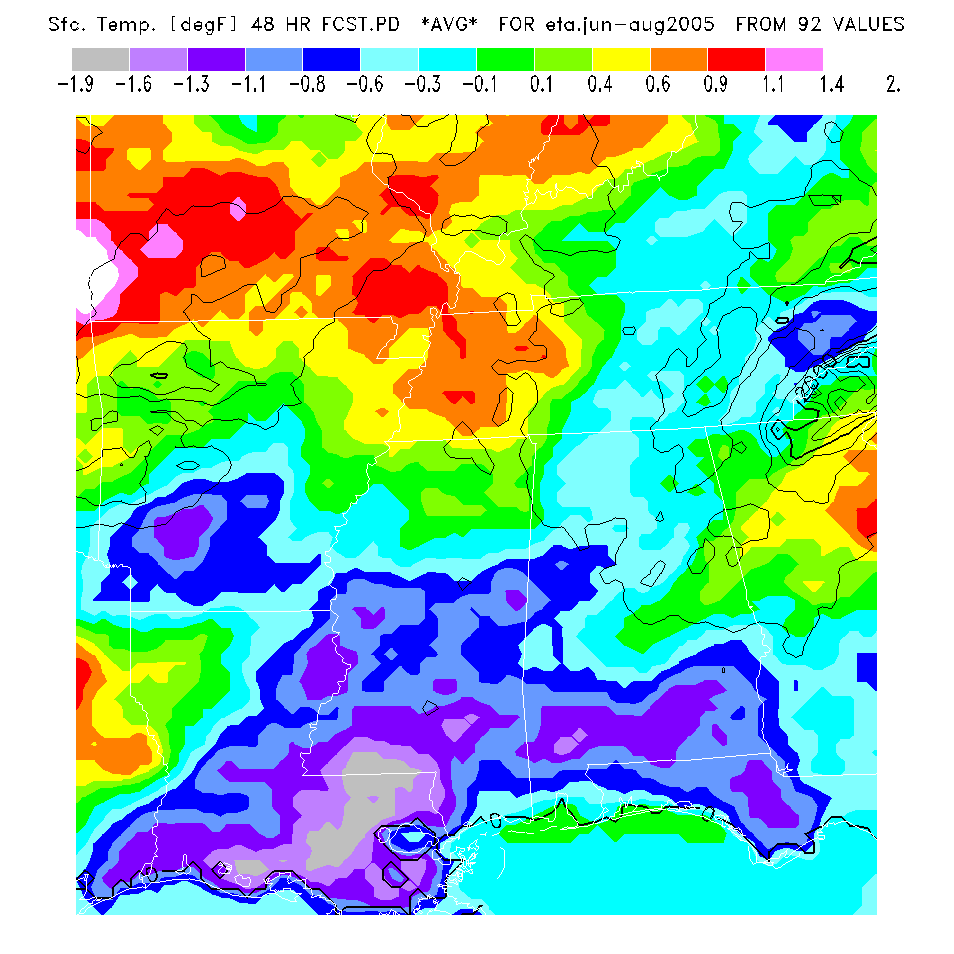
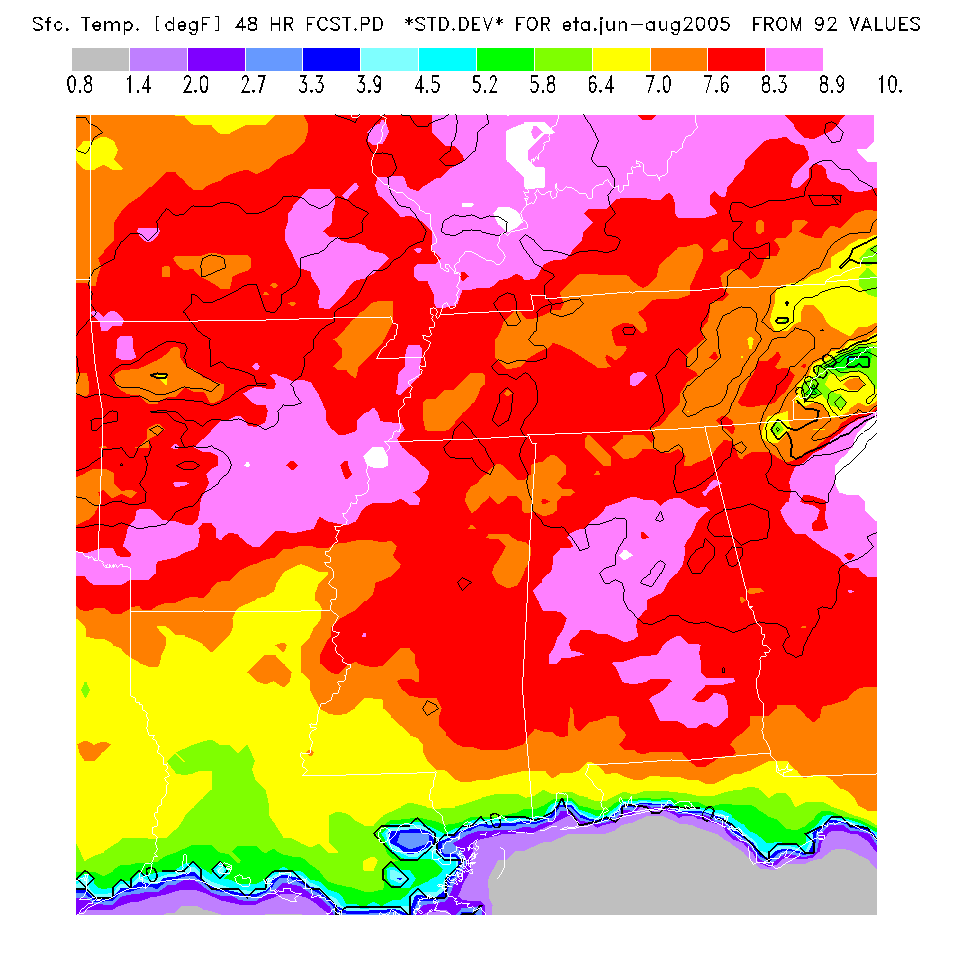
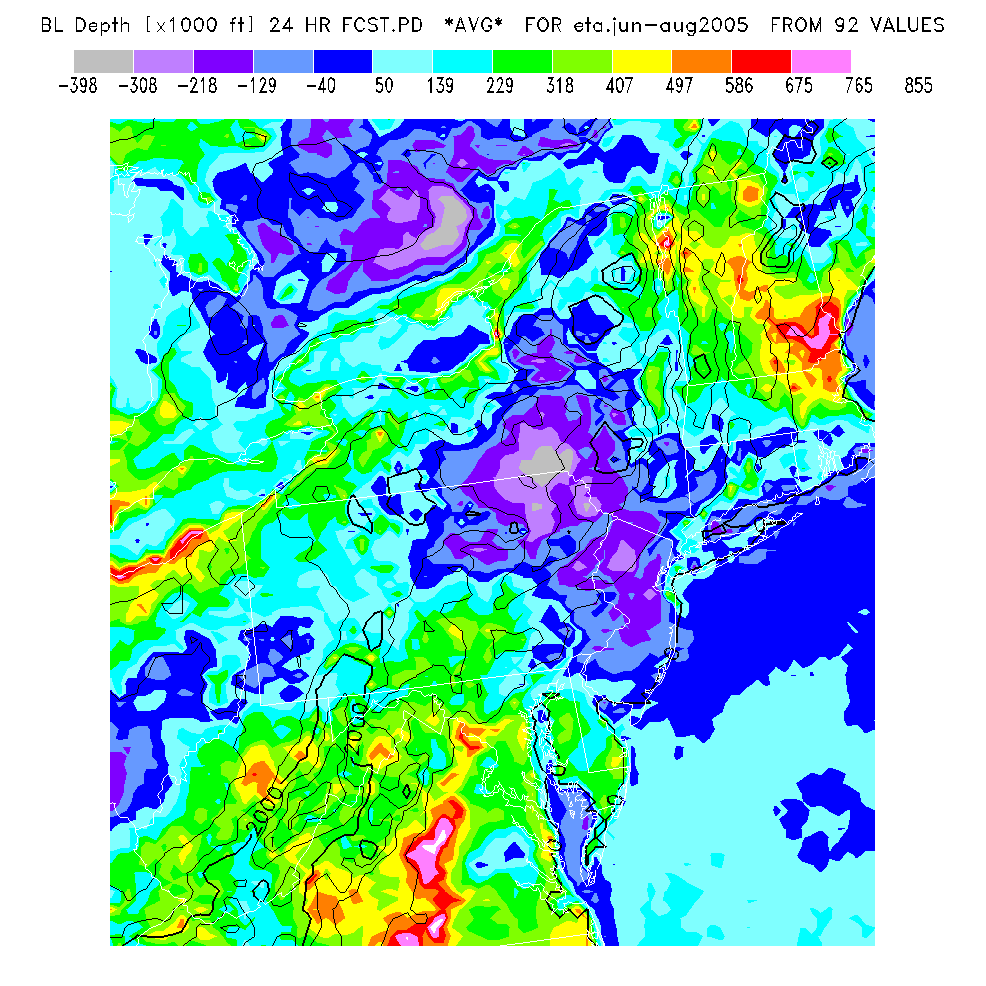
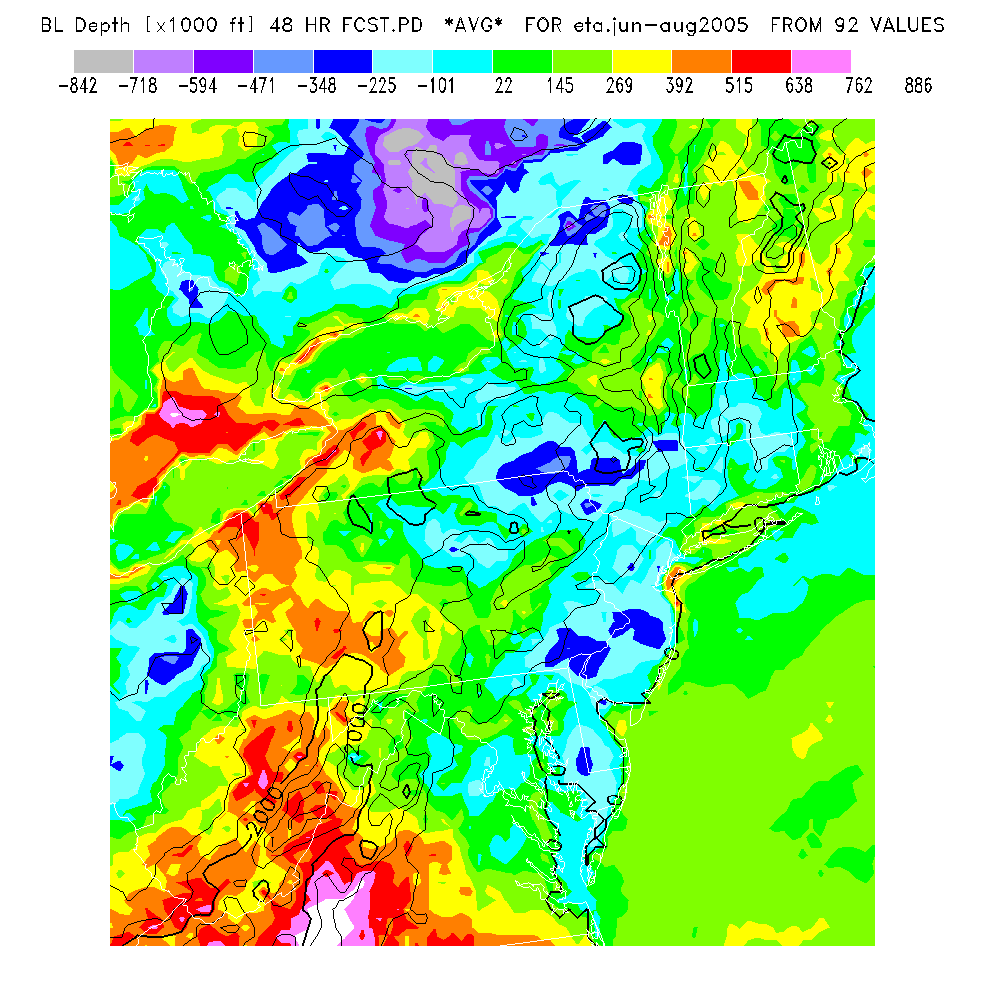
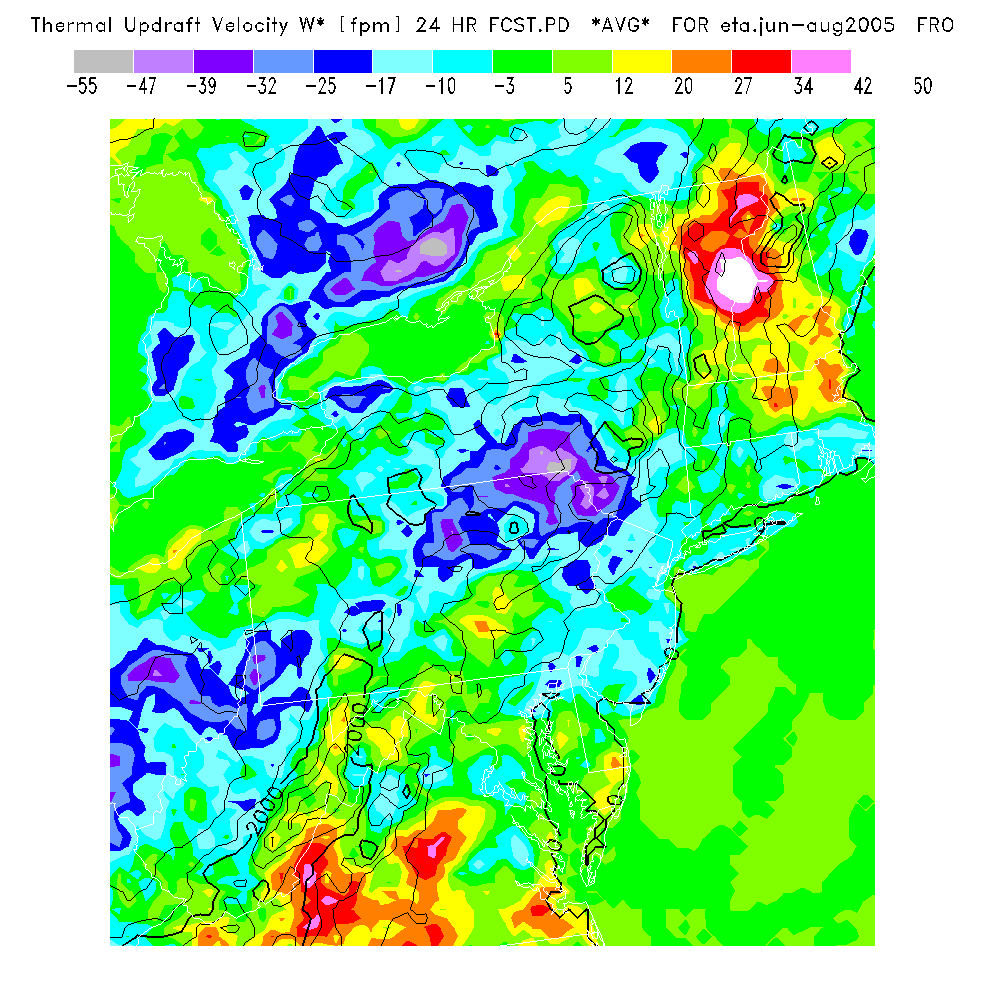
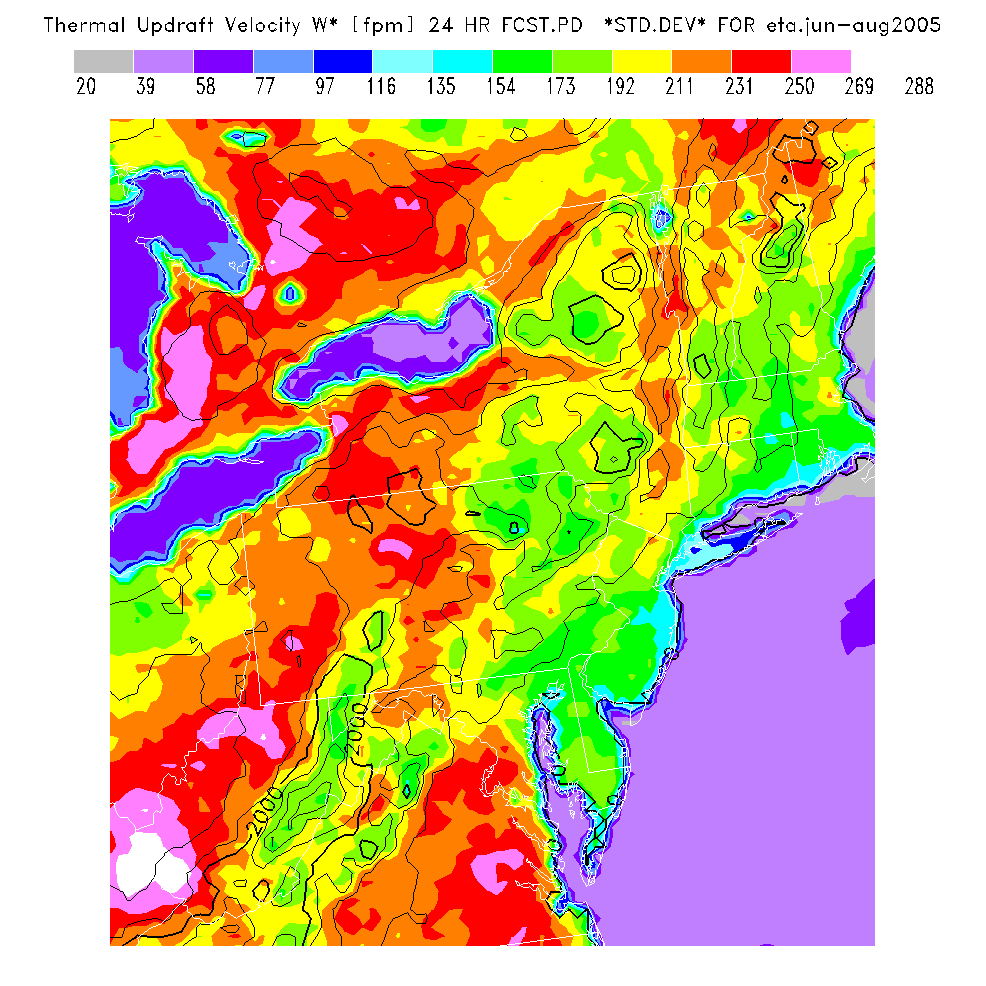
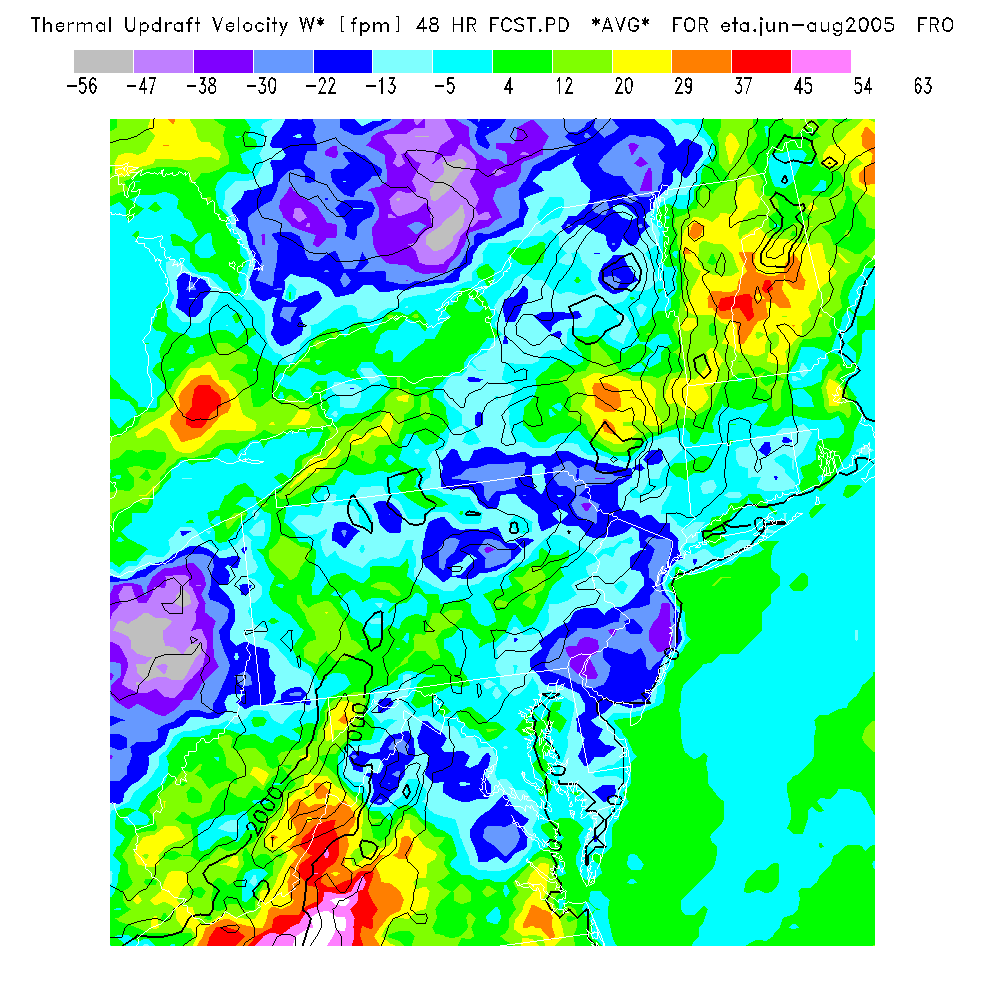
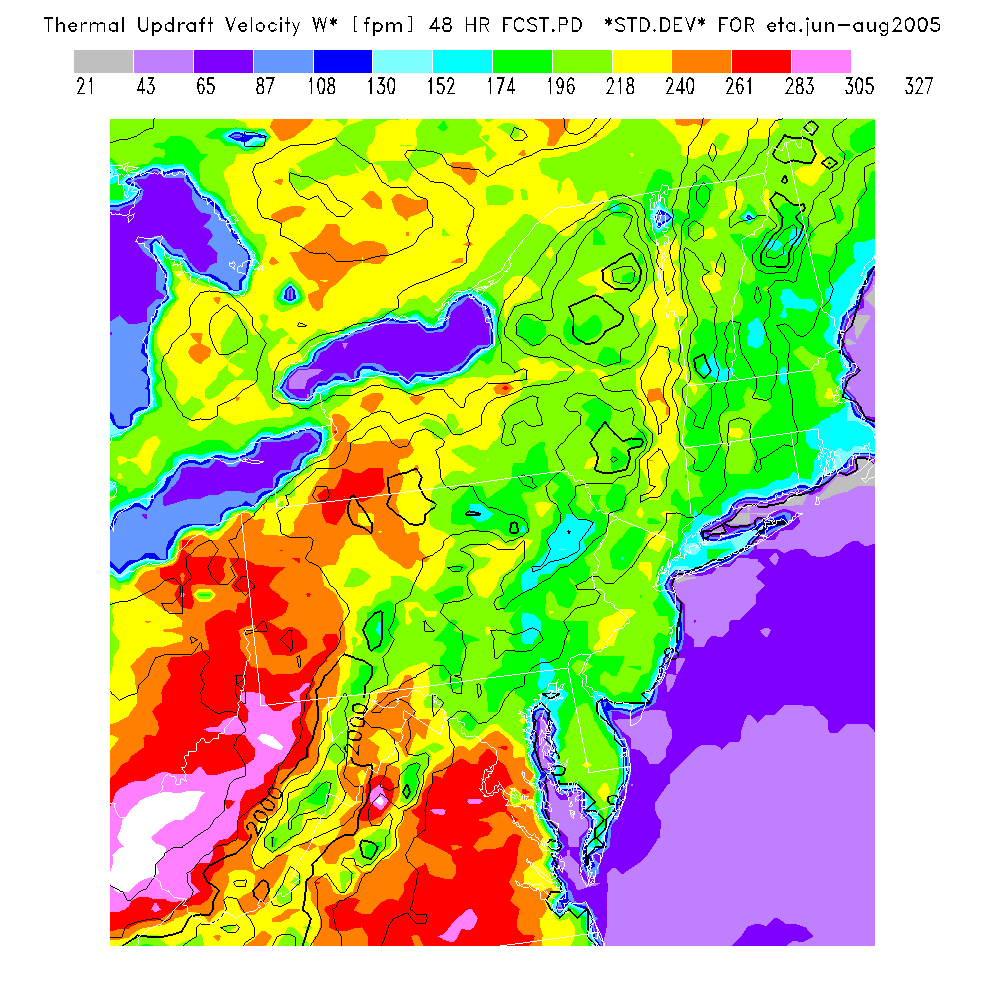
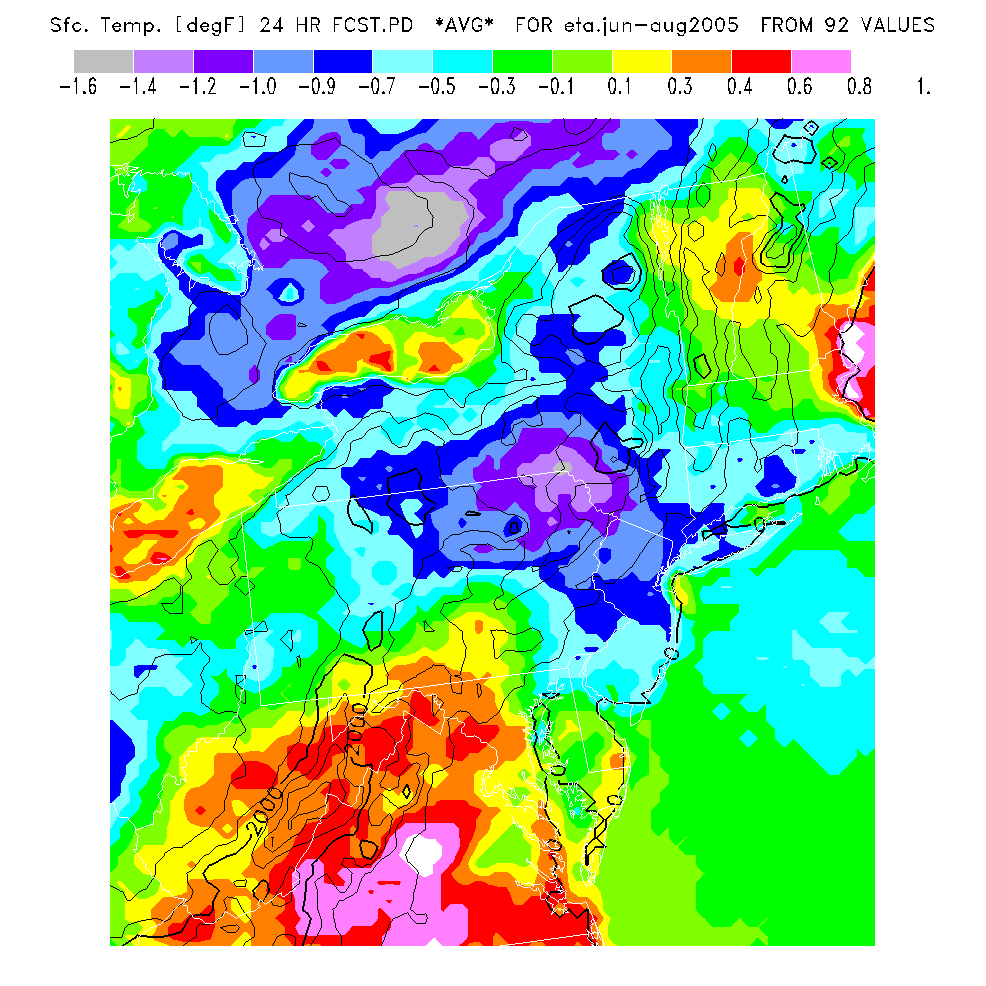
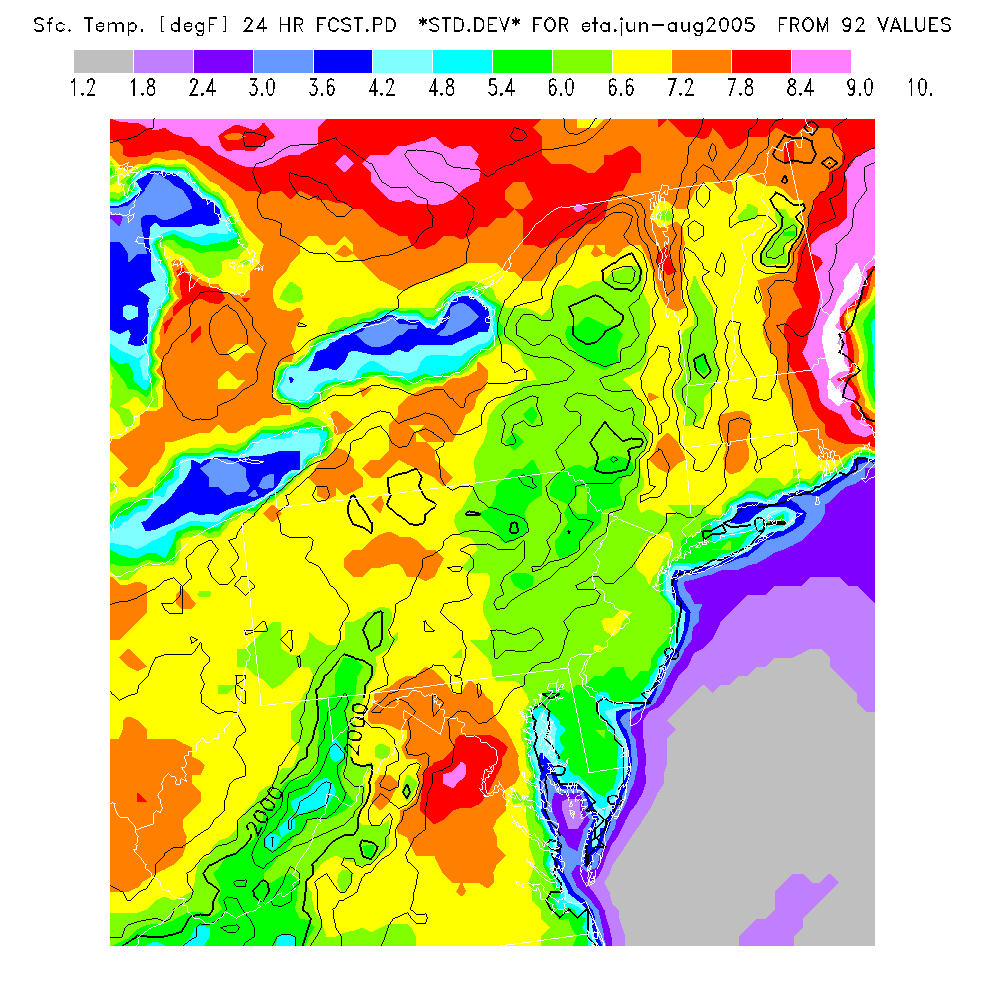
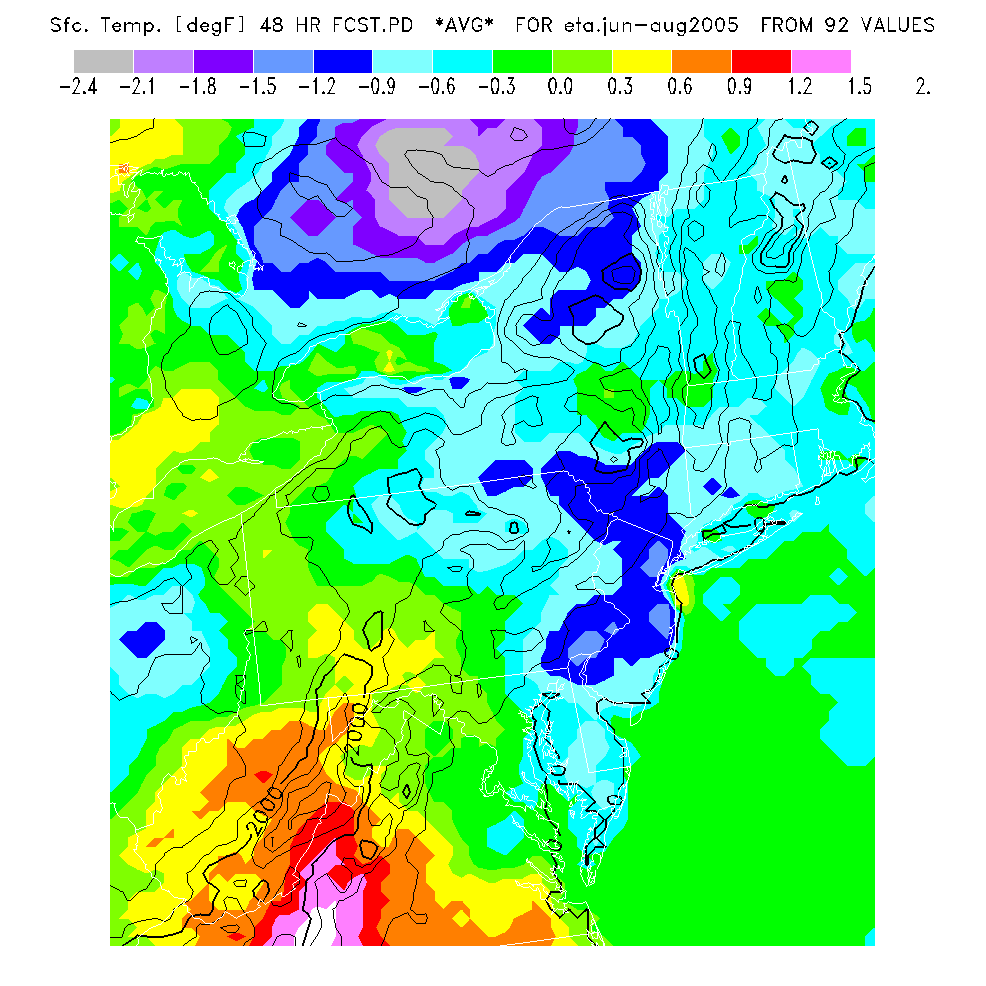
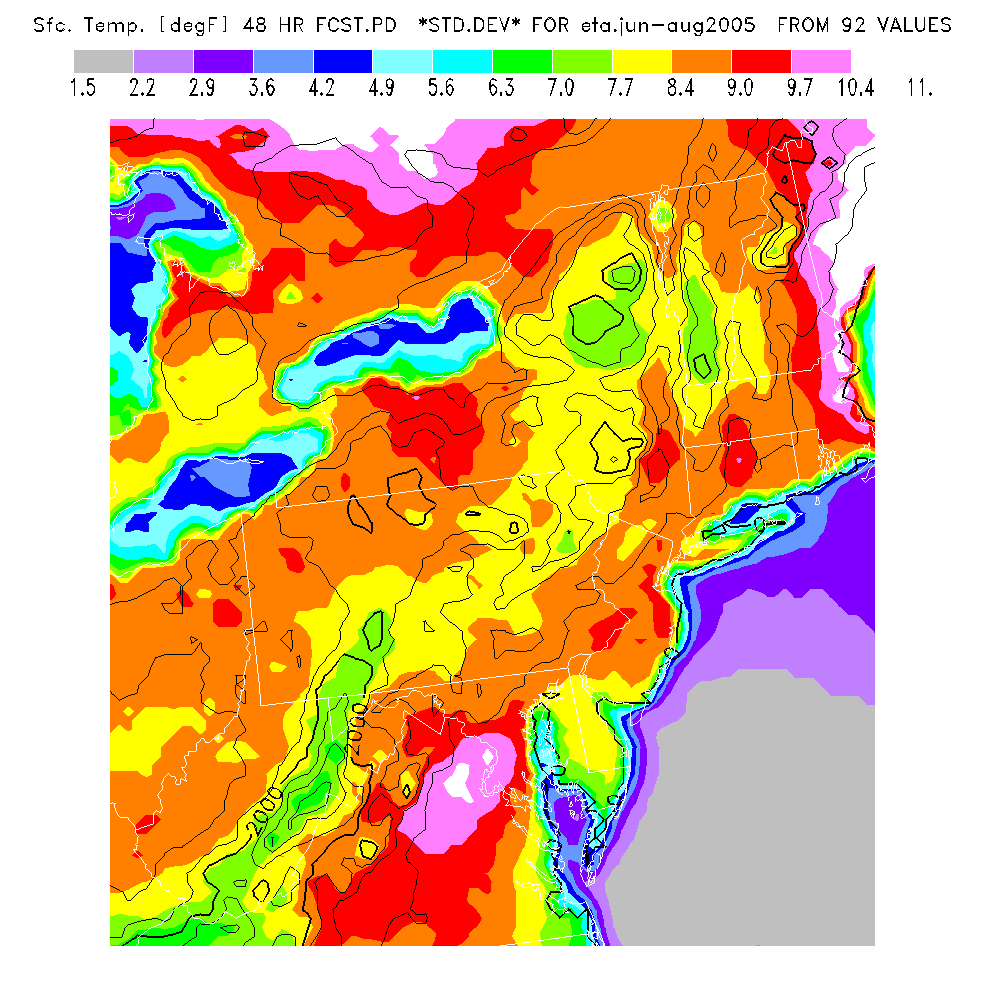
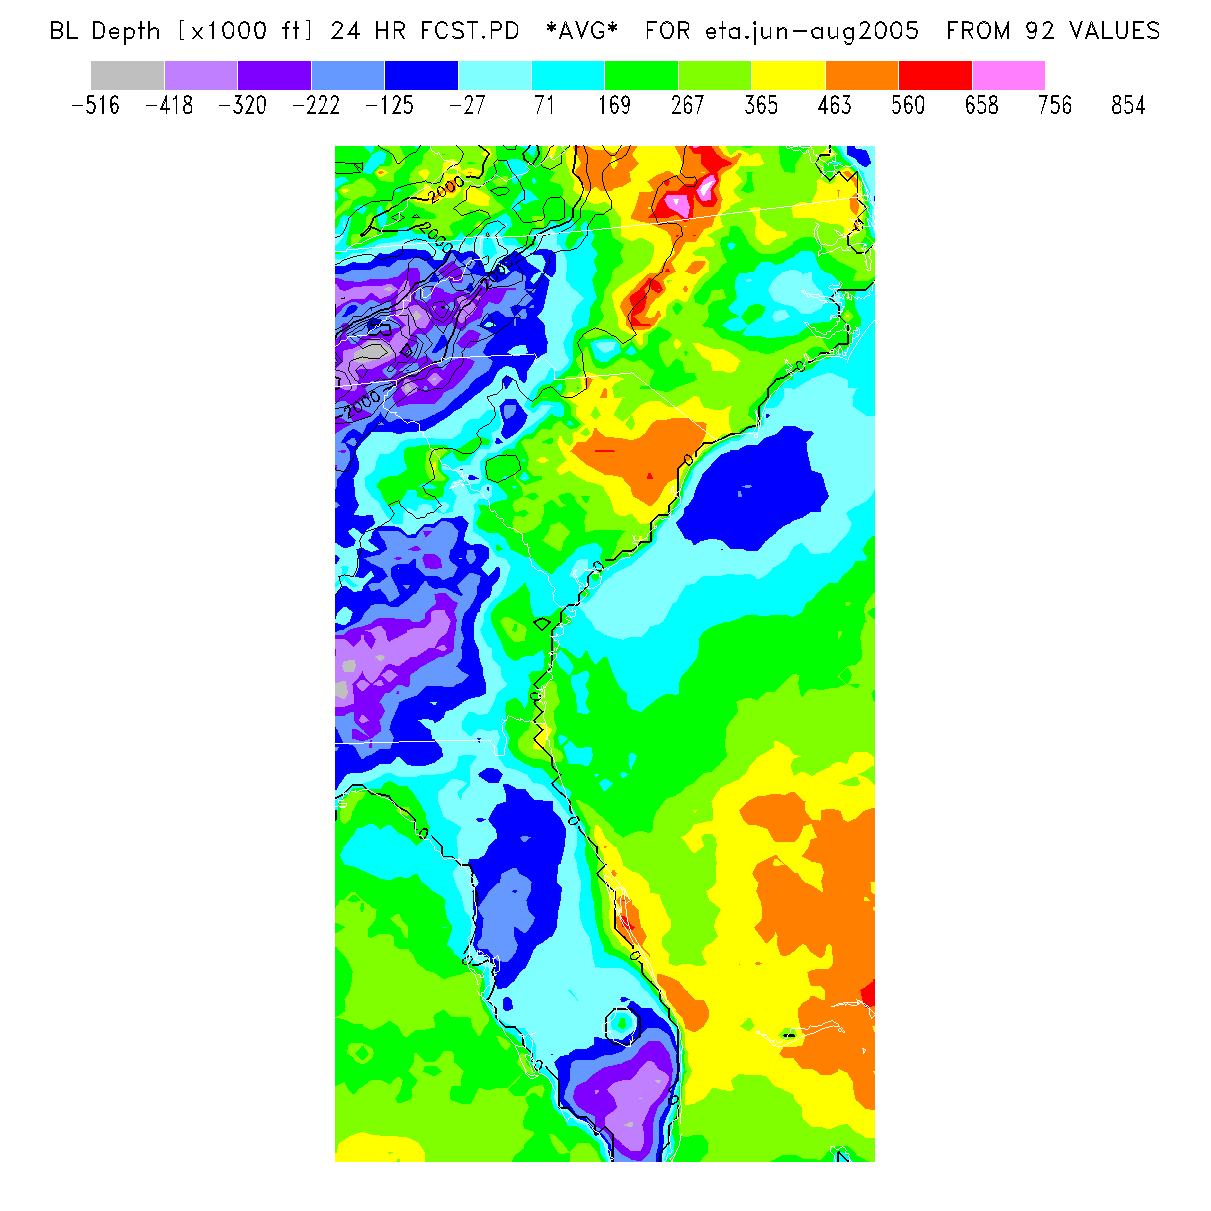
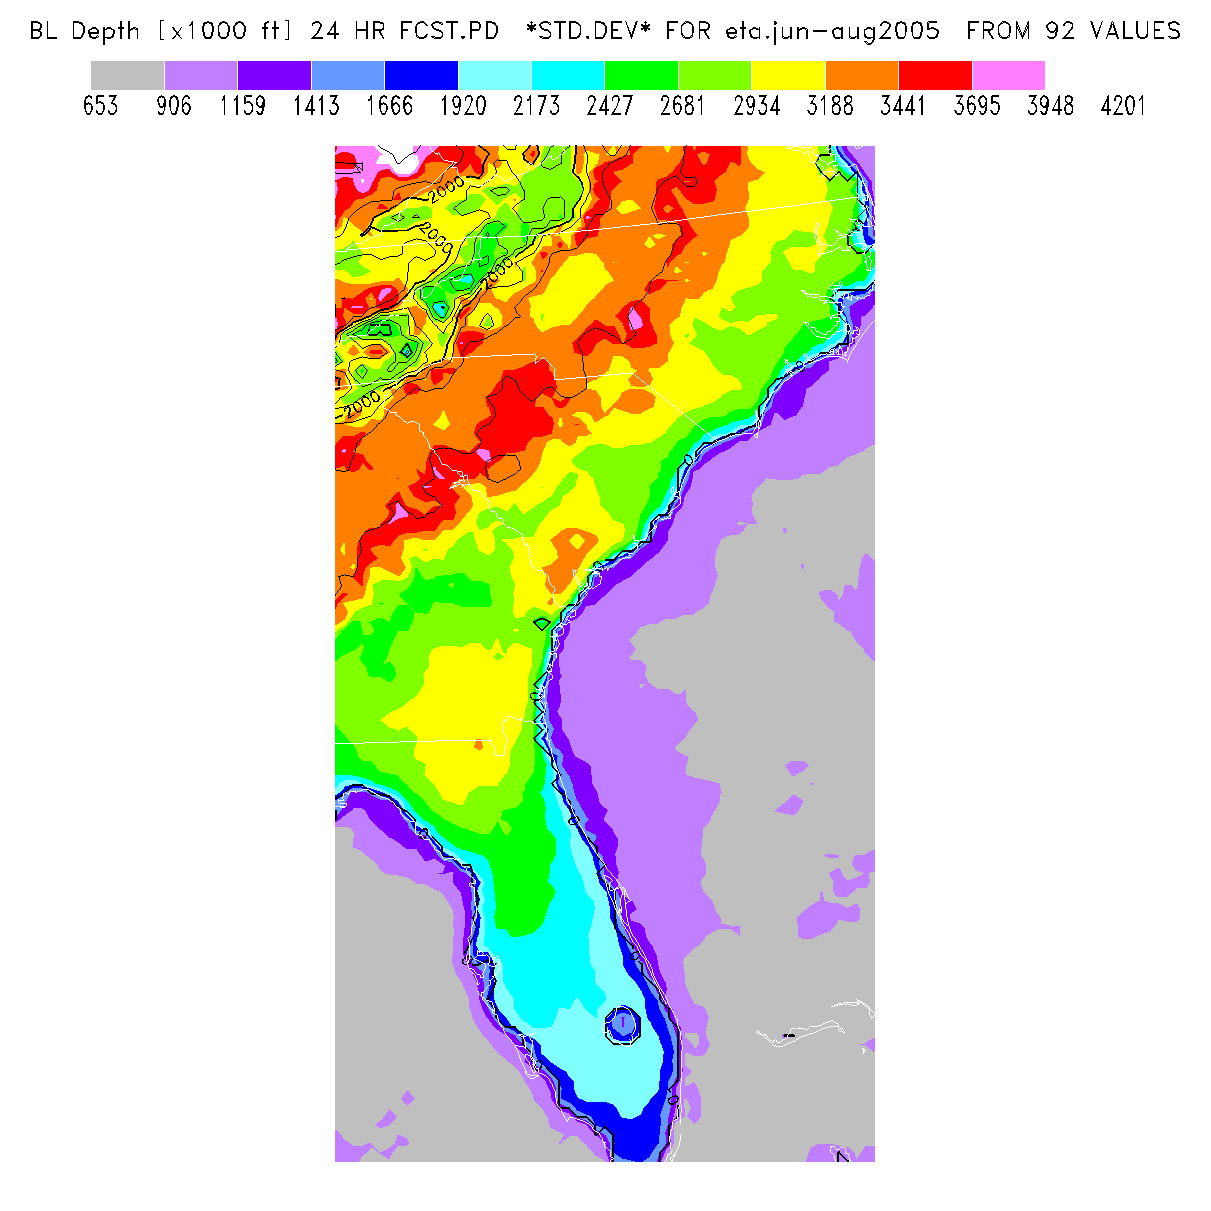
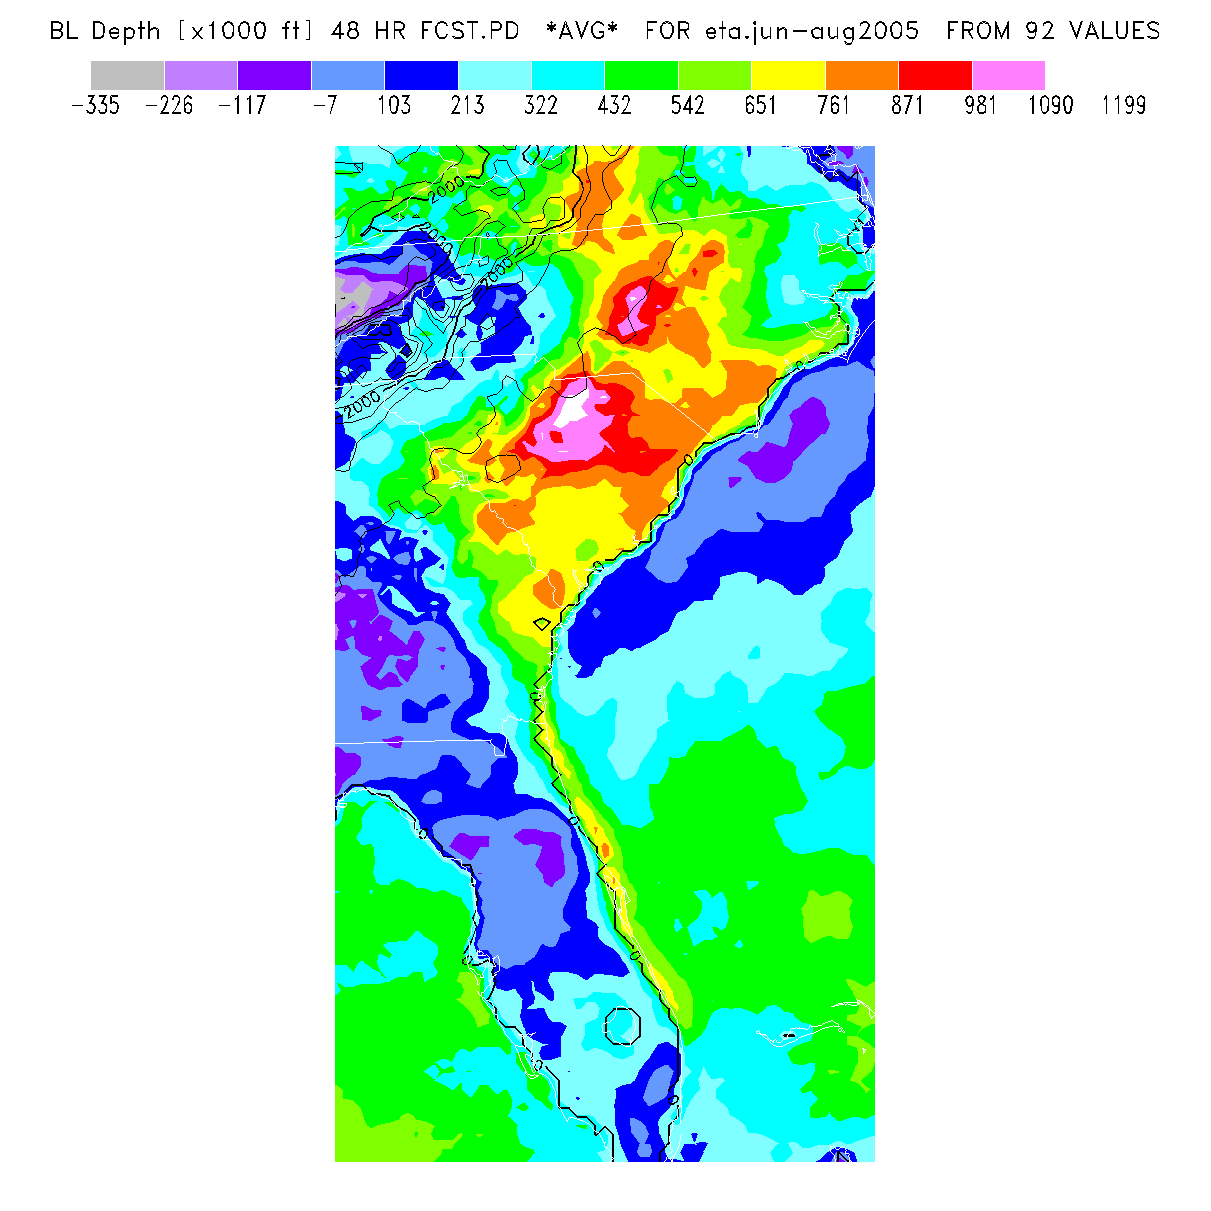
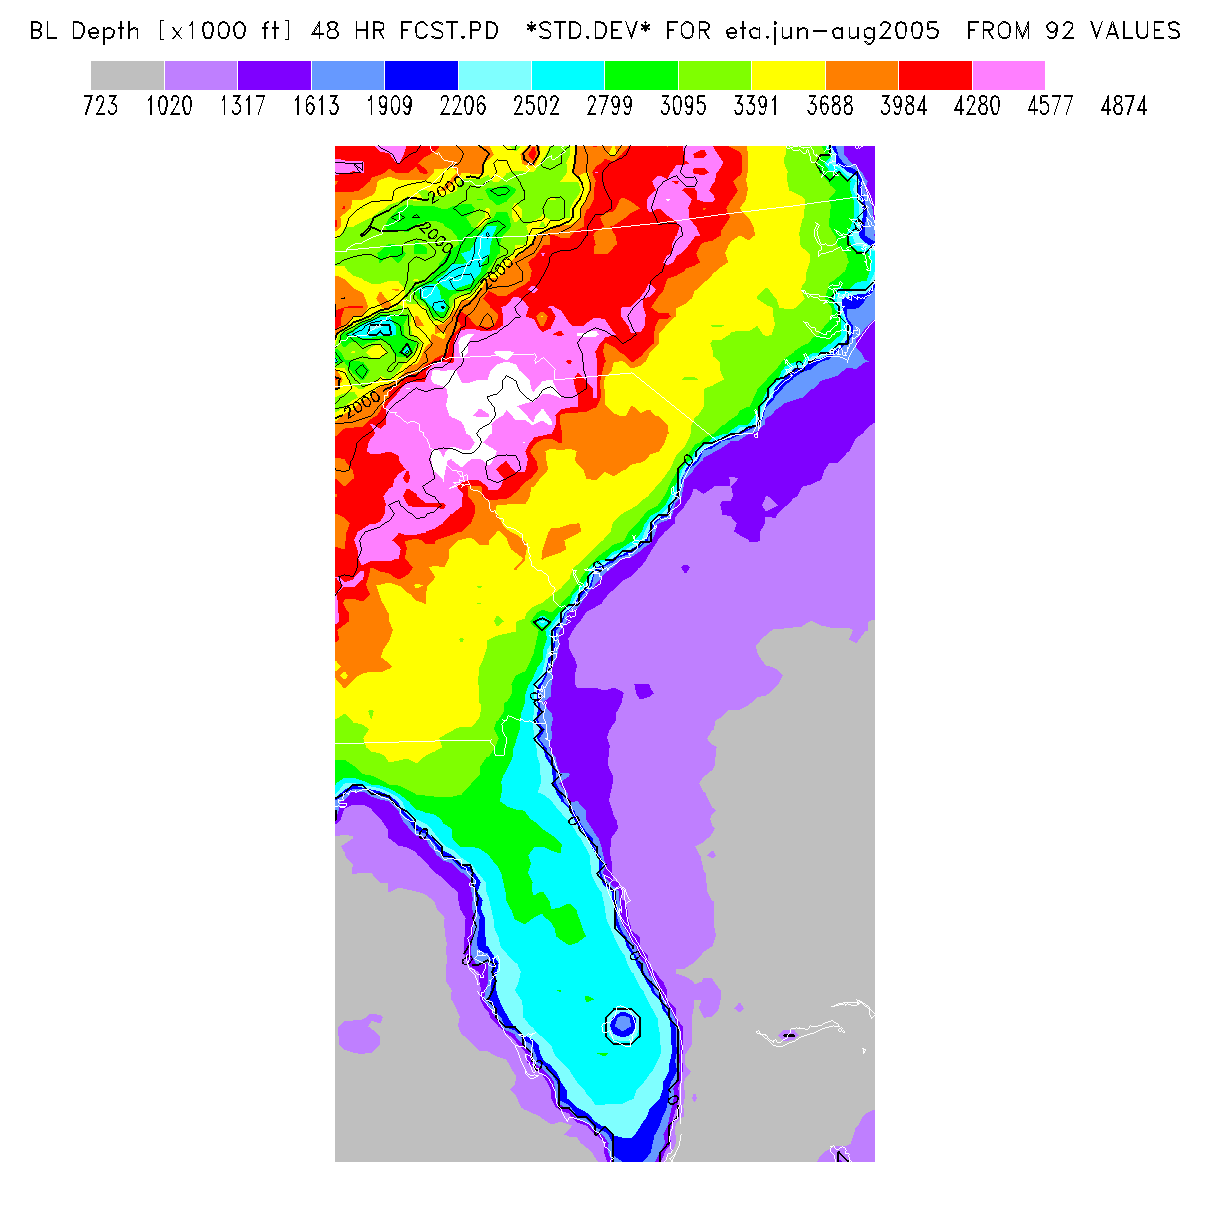
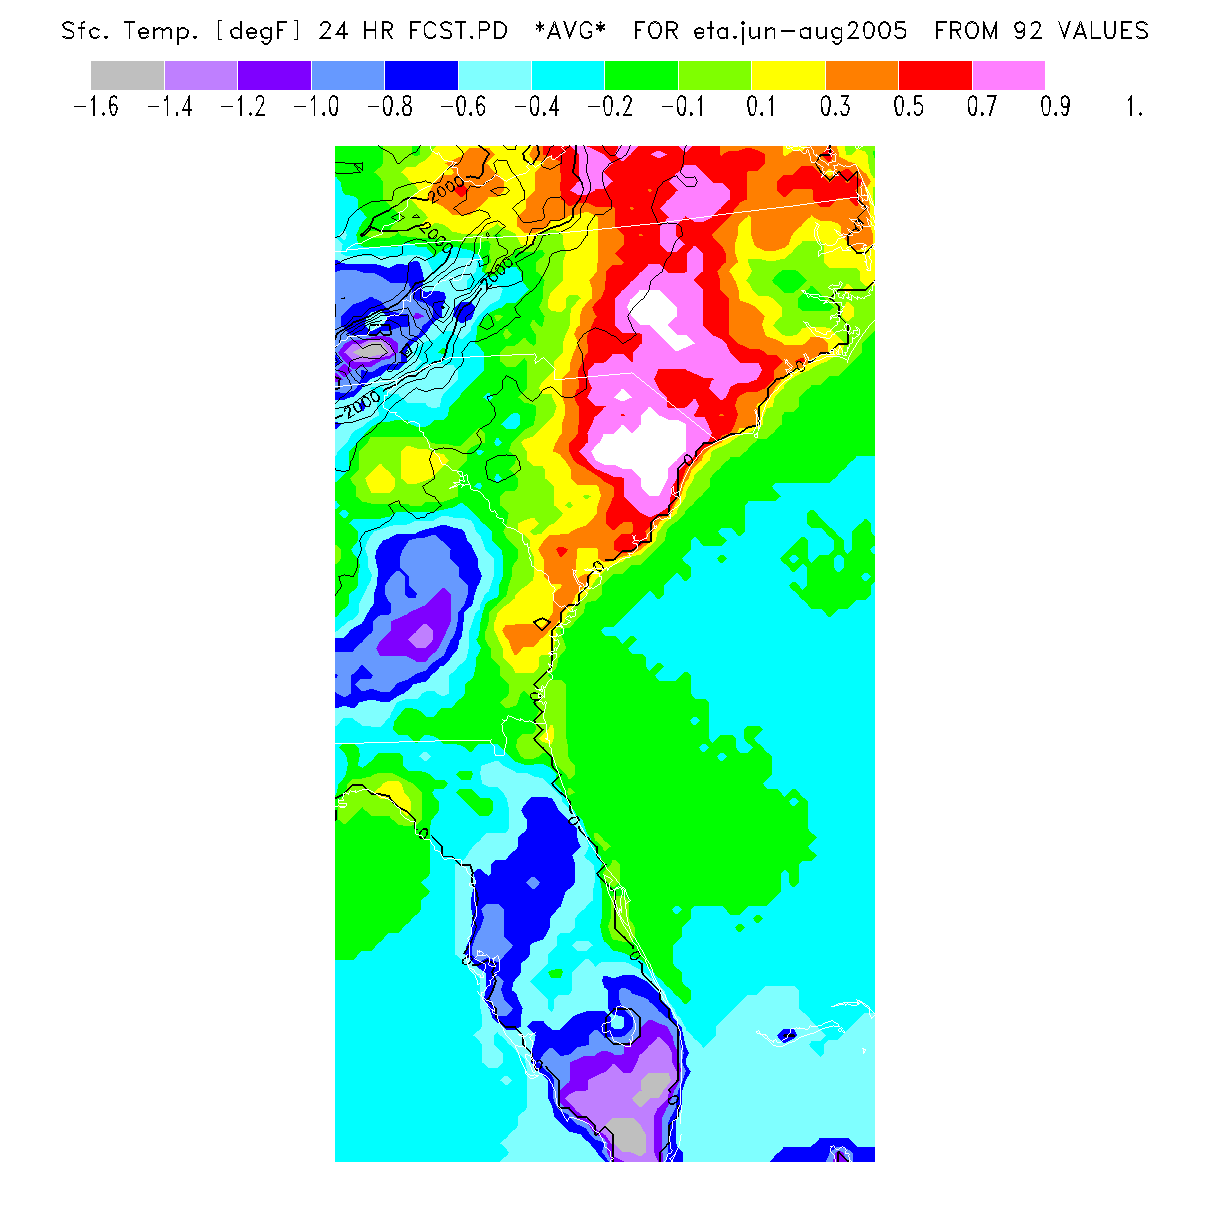
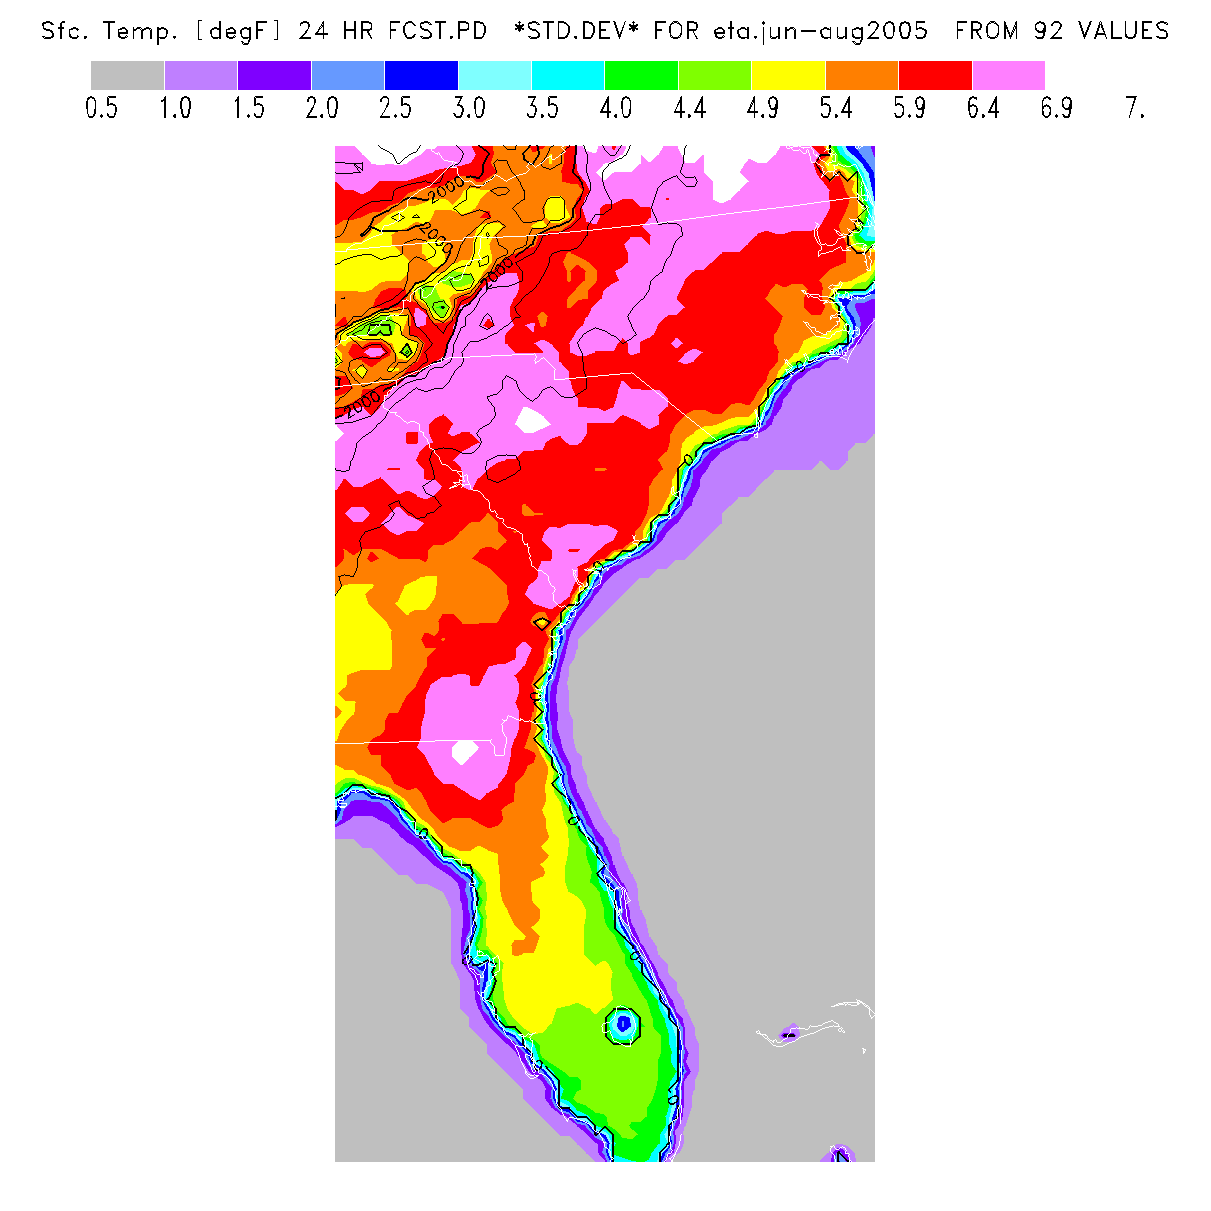
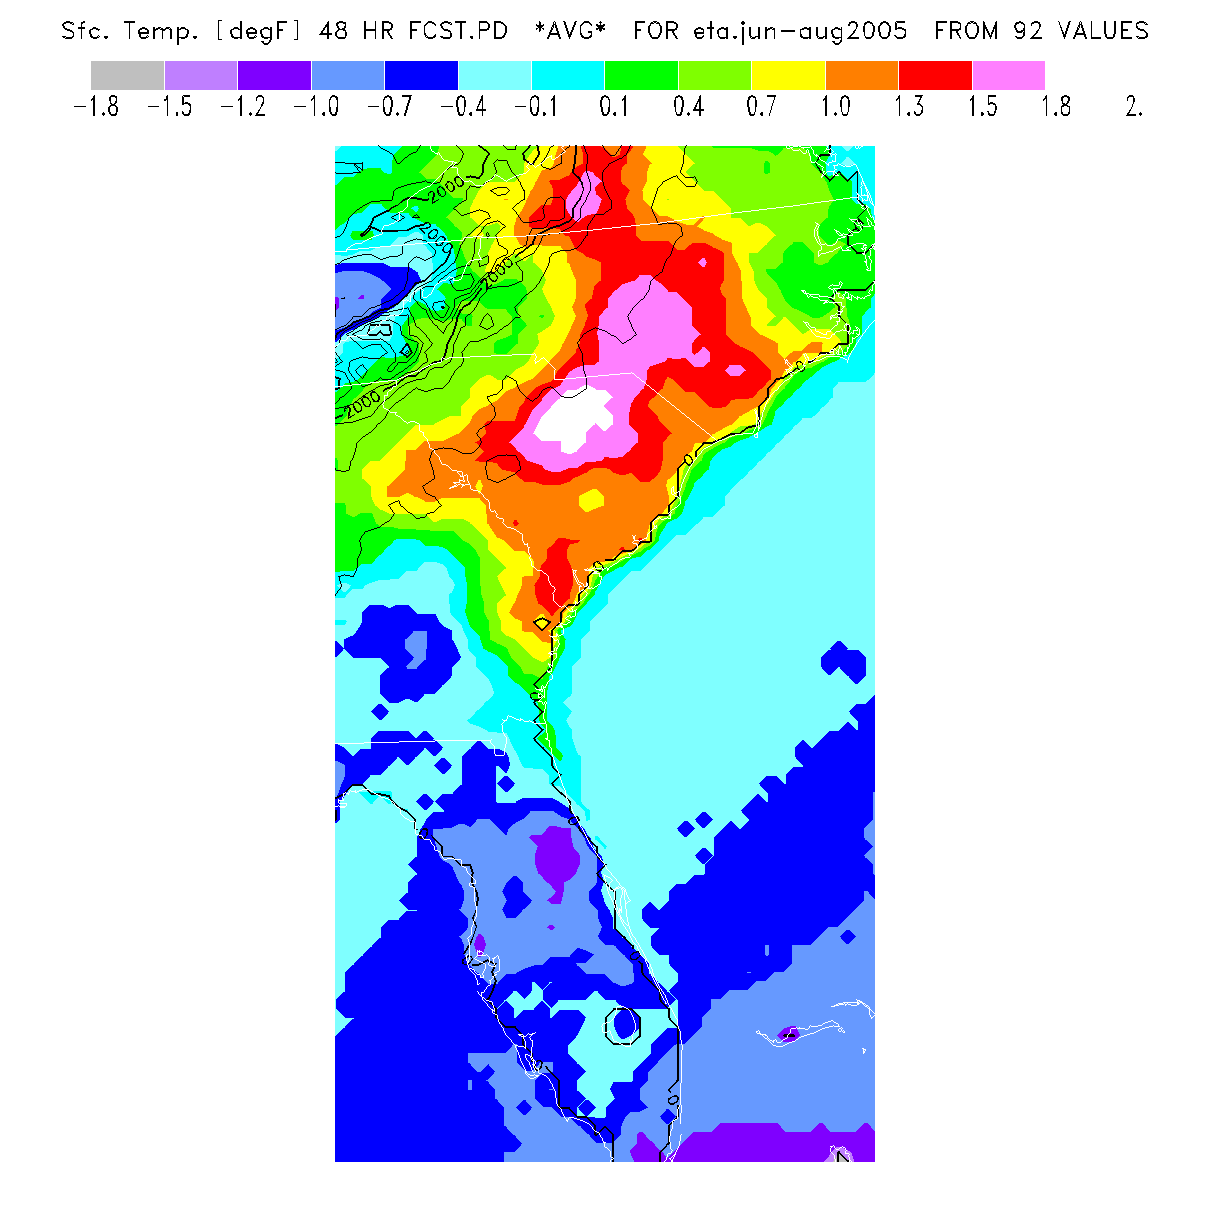
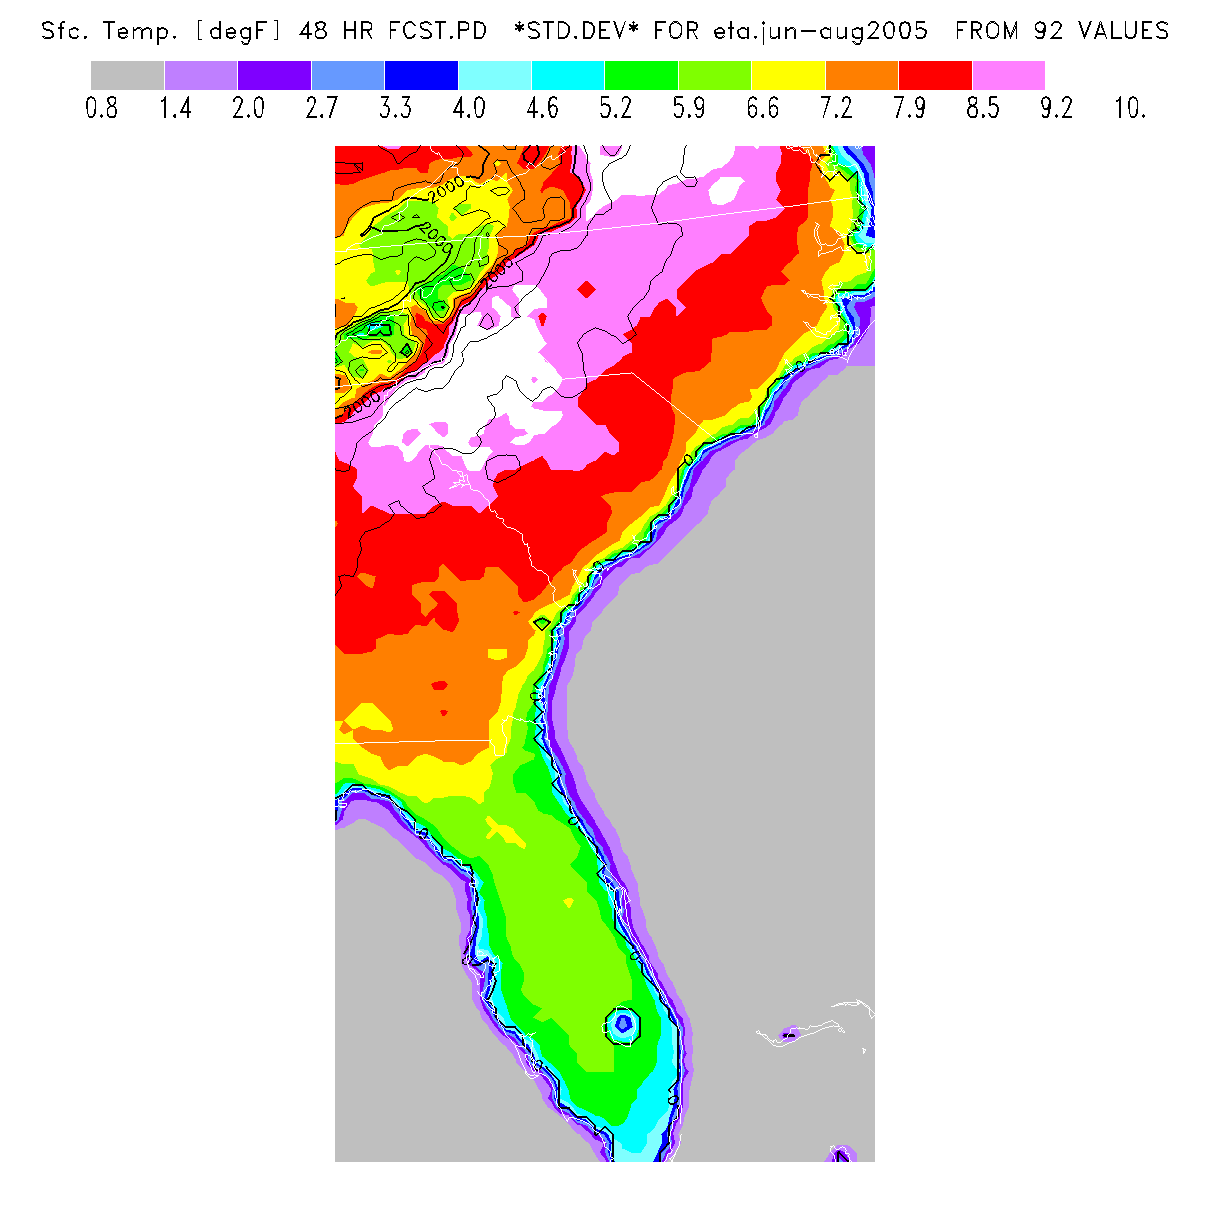
The numerical values are averaged over the entire region - results will be better/poorer at individual locations within that region. So I have also created 2D plots for each to show the differences between different subregions. It's important to recognize that this sampling is relatively small by meteorological standards and this summer's error pattern might well differ - still, these values do indicate the level of forecast error which can be expected from the NAM forecasts for days in advance and the locations where advance forecasts have been more difficult.
You might also think about psychological factors which can affect one's perception of the advance forecasts. I decided to do this analysis because too often it seemed that a much-better-than-average forecast 2 days in advance became a more-nearly average forecast by the final forecast - so I wanted to see if analysis would indeed indicate that two-day-ahead forecasts are on the average more optimistic than the final forecast. Such would be indicated by a large positive bias to the two-day-ahead forecasts and I did not find that to be the case - for my location the 2-day-ahead biases were relatively small. Then I realized that by focusing on especially good forecasts I was choosing a subset which is more likely to have a positive error, since a positive error will result in a strong day being forecast! If that error diminishes with time, as is likely due to the quasi-random nature of the error, then the final forecast is likely to have a smaller error than the 2-day-ahead forecast and hence be a less optimistic forecast. So if one considers only 2-day-ahead forecasts for strong conditions then indeed it is more likely than not that the final forecast will be less optimistic than the first forecast. This does not mean that all advance forecasts for strong conditions are in error, only that they are more likely to have an over-predicting error than is the average forecast.
Note: the plots of BL Depth error (which will be identical to the BL Top error, since terrain height is invariant) is labeled as being "x1000 ft" but is actually in feet.
Note: producing the 108 plots has been tedious so I have automated it as much as I could and have not checked every plot individually - if you find a discrepancy between the plot title and what the plot is supposed to represent post that information on the Blipmap Forum.
CA-NV Region
(21Z)
| Parameter |
Current+1 Bias |
Current+1 Std.Dev. |
Current+2 Bias |
Current+2 Std.Dev. |
| BL Depth |
+310
2D Plot |
2016
2D Plot |
+475
2D Plot |
2508
2D Plot |
| Thermal Updraft Velocity |
+10
2D Plot |
76
2D Plot |
+13
2D Plot |
88
2D Plot |
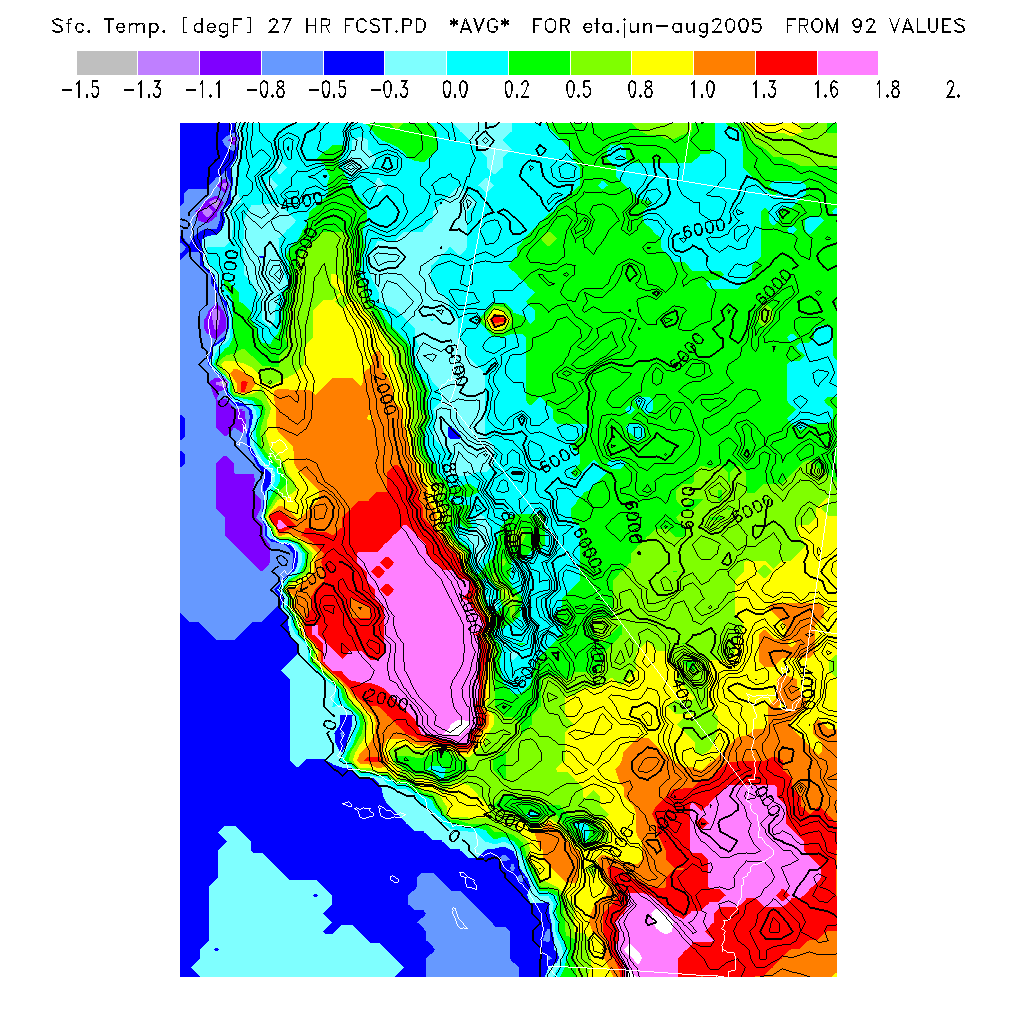
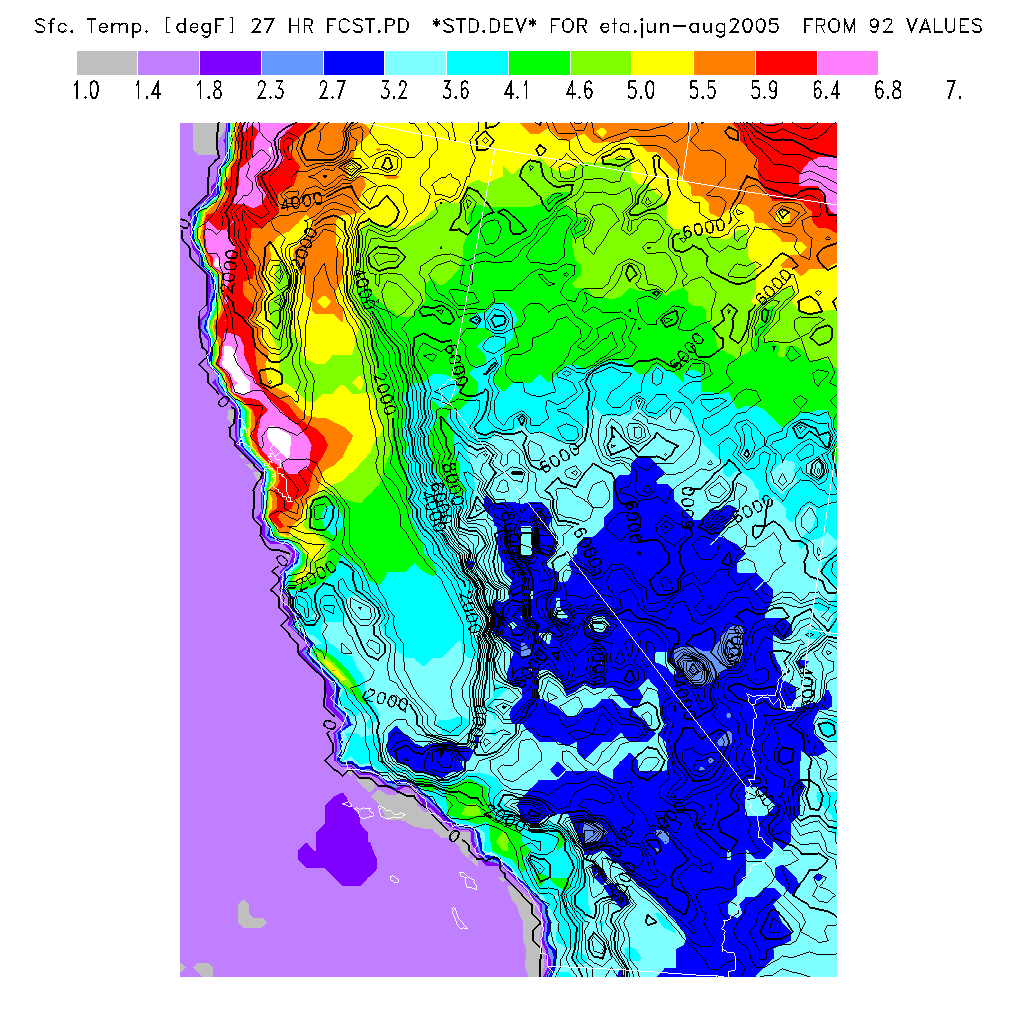
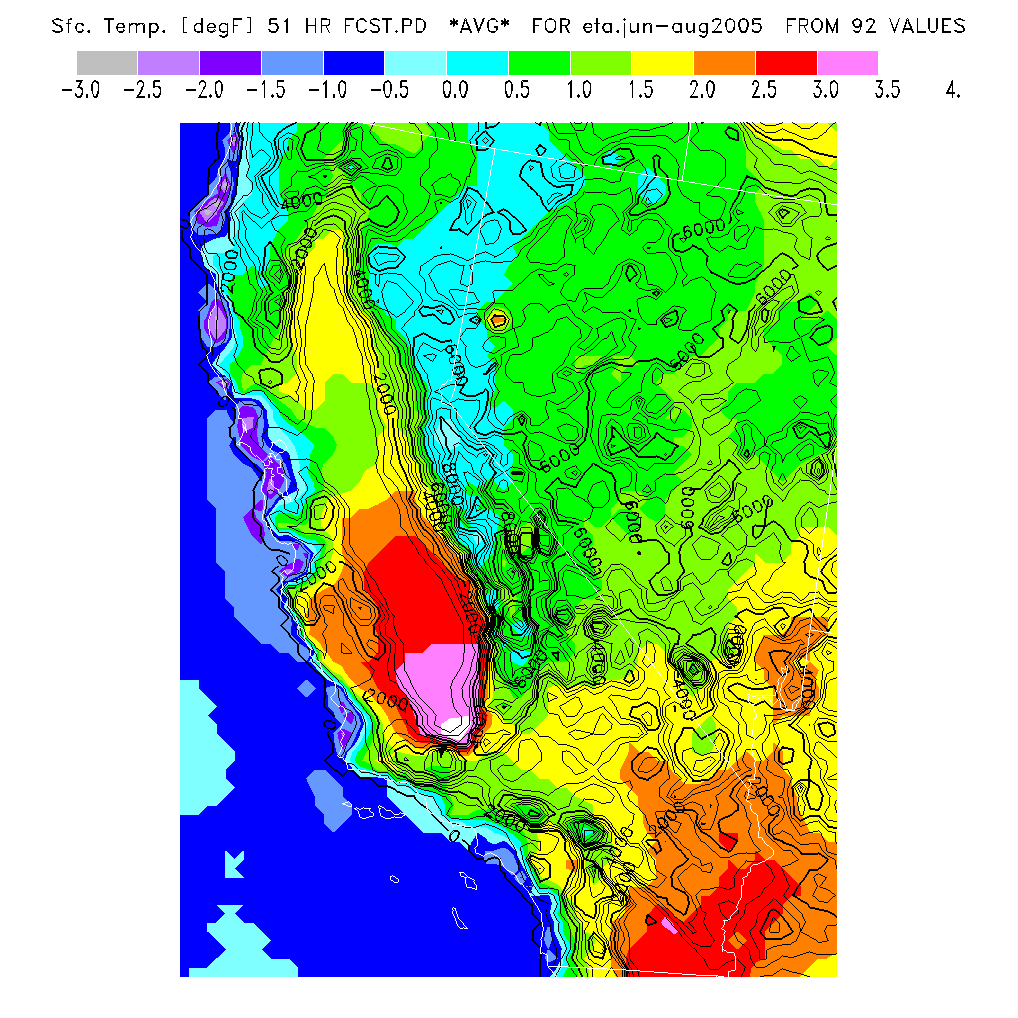
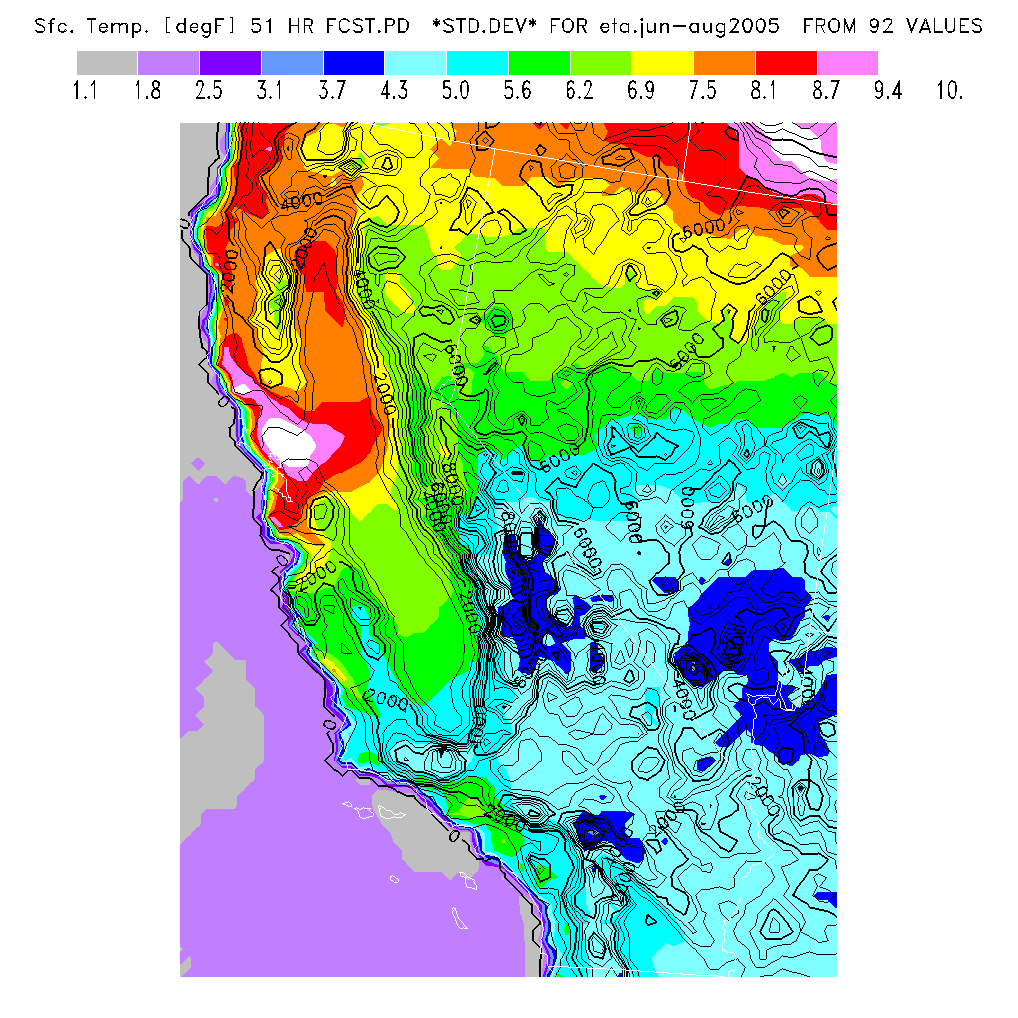
| Surface Temperature |
+0.4
2D Plot |
3.9
2D Plot |
+0.8
2D Plot |
5.7
2D Plot |
NW Region
(21Z)
| Parameter |
Current+1 Bias |
Current+1 Std.Dev. |
Current+2 Bias |
Current+2 Std.Dev. |
| BL Depth |
+124
2D Plot |
2795
2D Plot |
+174
2D Plot |
3083
2D Plot |
| Thermal Updraft Velocity |
+2
2D Plot |
158
2D Plot |
+4
2D Plot |
162
2D Plot |
| Surface Temperature |
0.0
2D Plot |
7.4
2D Plot |
0.0
2D Plot |
9.9
2D Plot |
SW Region
(21Z)
| Parameter |
Current+1 Bias |
Current+1 Std.Dev. |
Current+2 Bias |
Current+2 Std.Dev. |
| BL Depth |
+158
2D Plot |
3050
2D Plot |
+331
2D Plot |
3668
2D Plot |
| Thermal Updraft Velocity |
0
2D Plot |
148
2D Plot |
0
2D Plot |
163
2D Plot |
| Surface Temperature |
+0.3
2D Plot |
5.2
2D Plot |
+0.8
2D Plot |
6.7
2D Plot |
GP Region
(21Z)
| Parameter |
Current+1 Bias |
Current+1 Std.Dev. |
Current+2 Bias |
Current+2 Std.Dev. |
| BL Depth |
+411
2D Plot |
3784
2D Plot |
+423
2D Plot |
4201
2D Plot |
| Thermal Updraft Velocity |
-3
2D Plot |
181
2D Plot |
+1
2D Plot |
179
2D Plot |
| Surface Temperature |
+0.1
2D Plot |
7.9
2D Plot |
+0.3
2D Plot |
10.1
2D Plot |
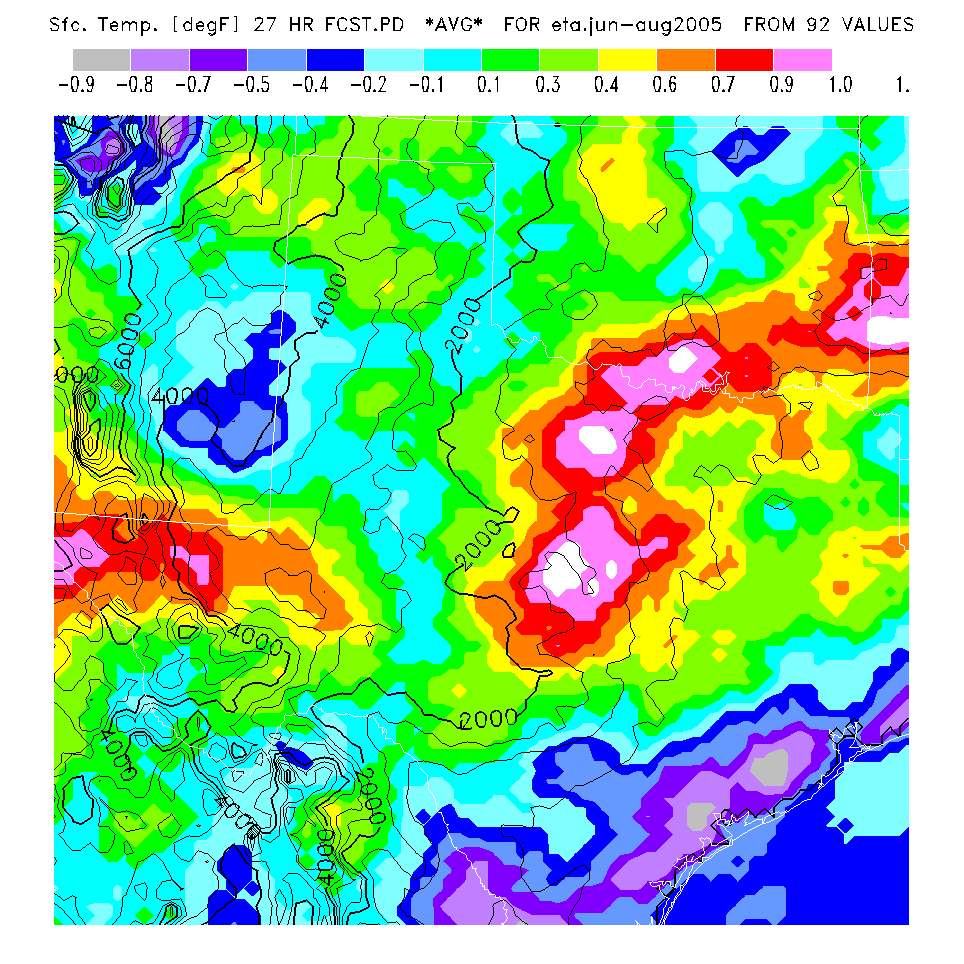
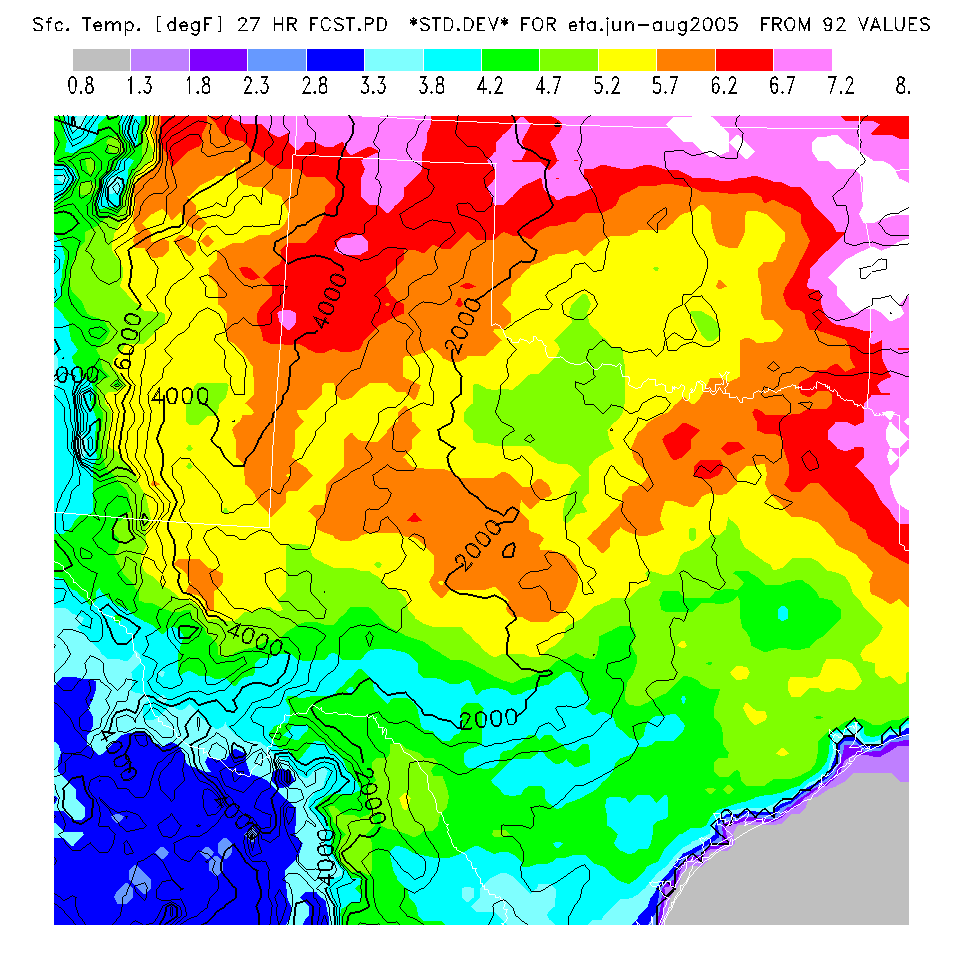
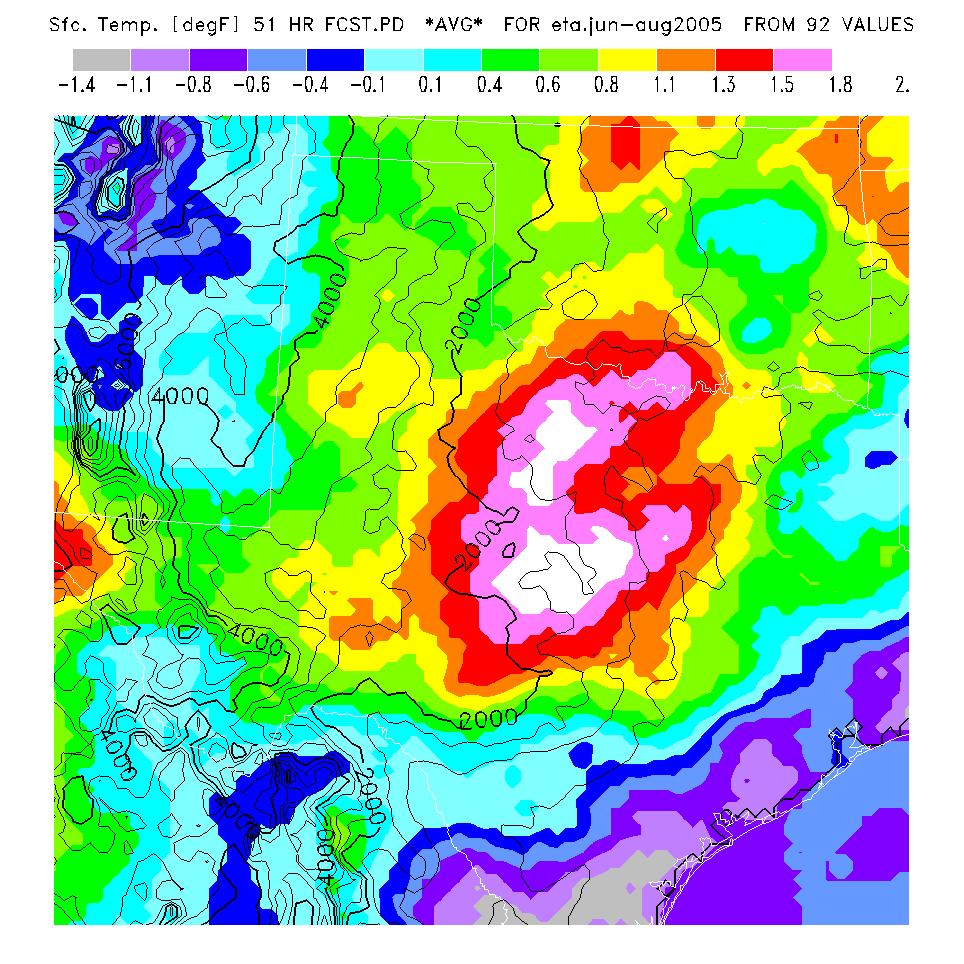
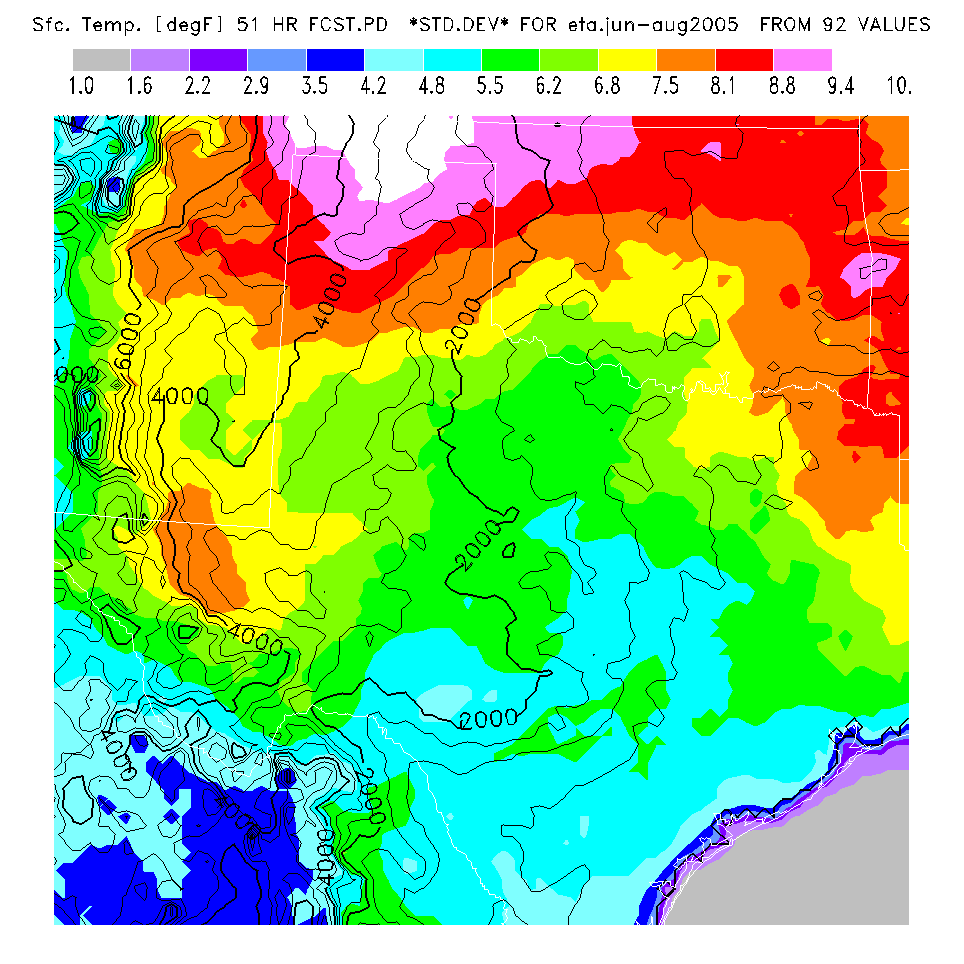
OK-TX Region
(21Z)
| Parameter |
Current+1 Bias |
Current+1 Std.Dev. |
Current+2 Bias |
Current+2 Std.Dev. |
| BL Depth |
+182
2D Plot |
3016
2D Plot |
+339
2D Plot |
3489
2D Plot |
| Thermal Updraft Velocity |
+2
2D Plot |
162
2D Plot |
+9
2D Plot |
176
2D Plot |
| Surface Temperature |
+0.2
2D Plot |
5.2
2D Plot |
+0.4
2D Plot |
6.5
2D Plot |
NC Region
(18Z)
| Parameter |
Current+1 Bias |
Current+1 Std.Dev. |
Current+2 Bias |
Current+2 Std.Dev. |
| BL Depth |
+149
2D Plot |
2994
2D Plot |
+183
2D Plot |
3350
2D Plot |
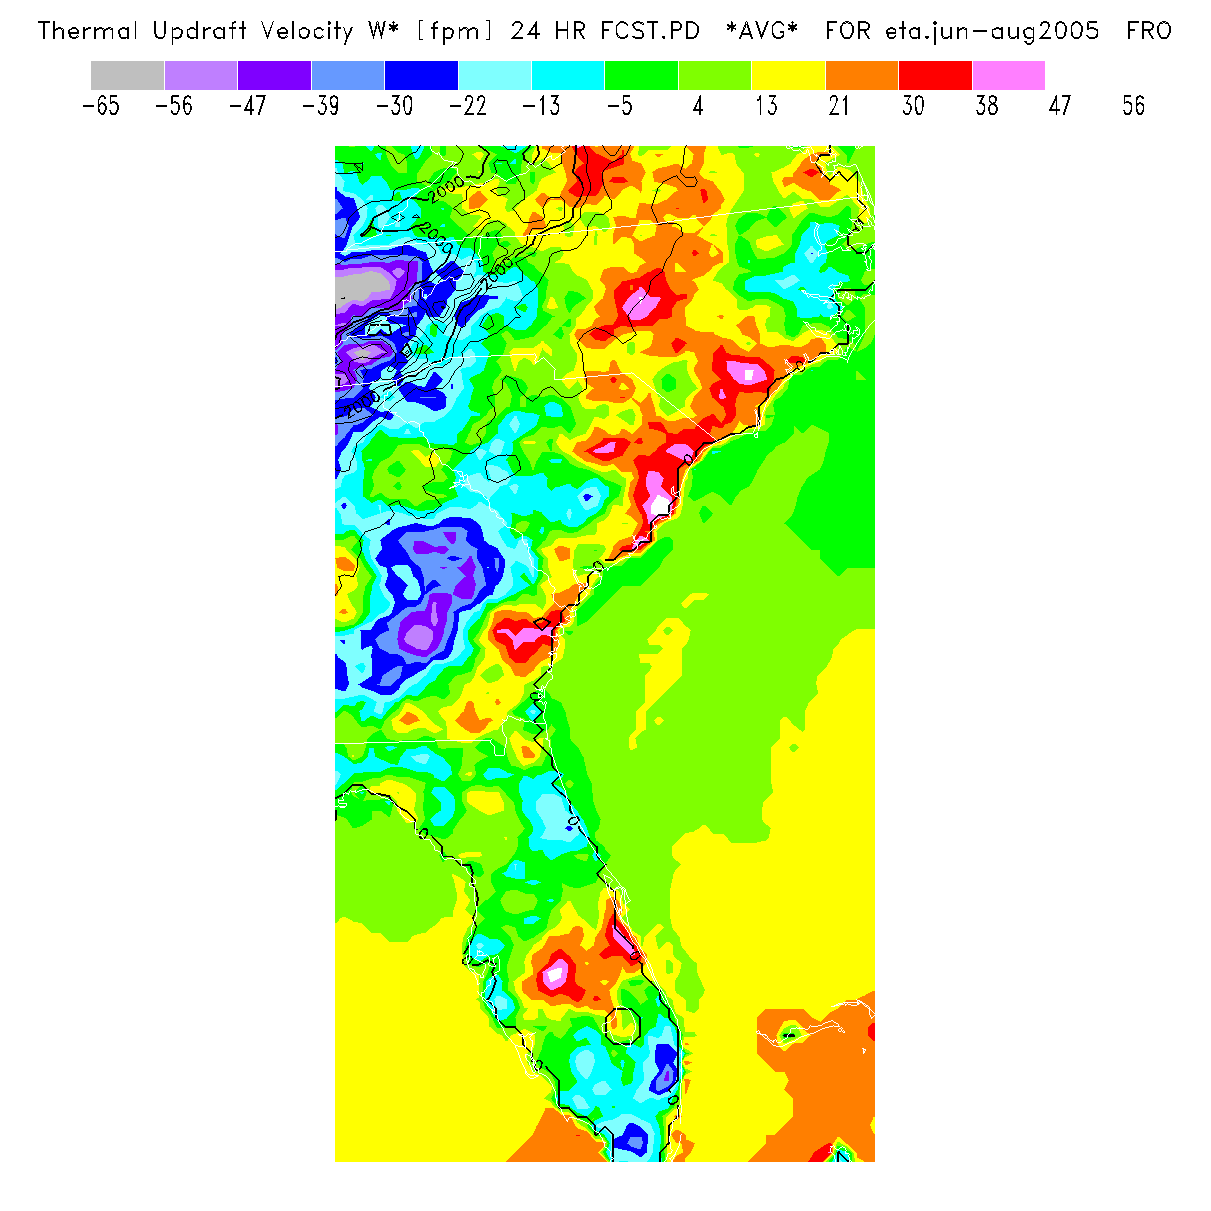
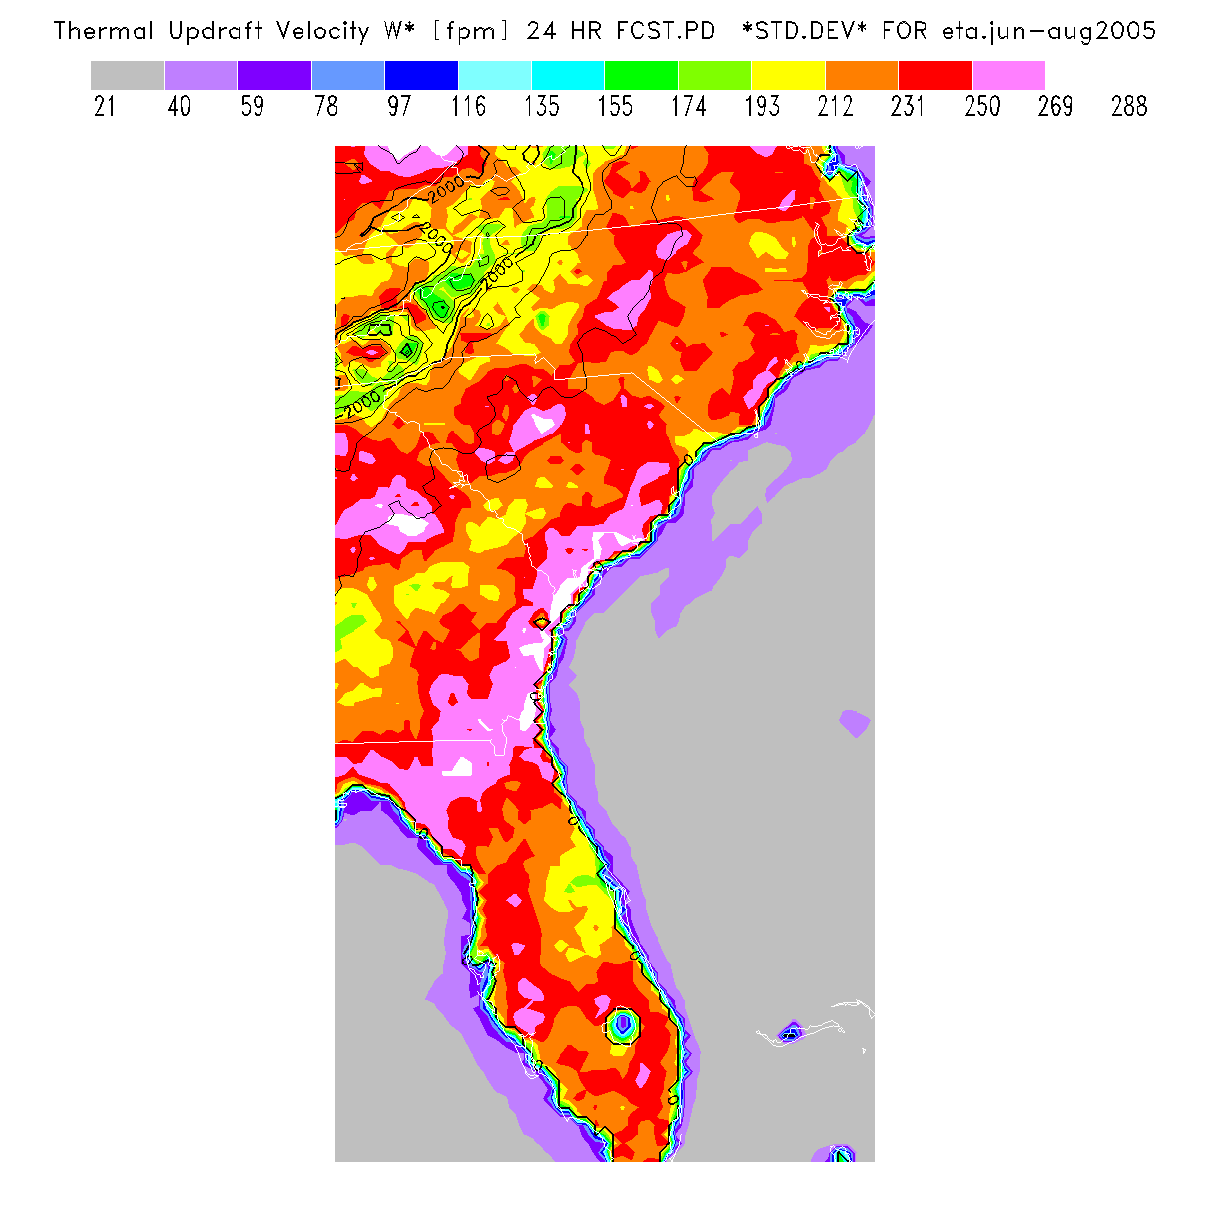
| Thermal Updraft Velocity |
-16
2D Plot |
192
2D Plot |
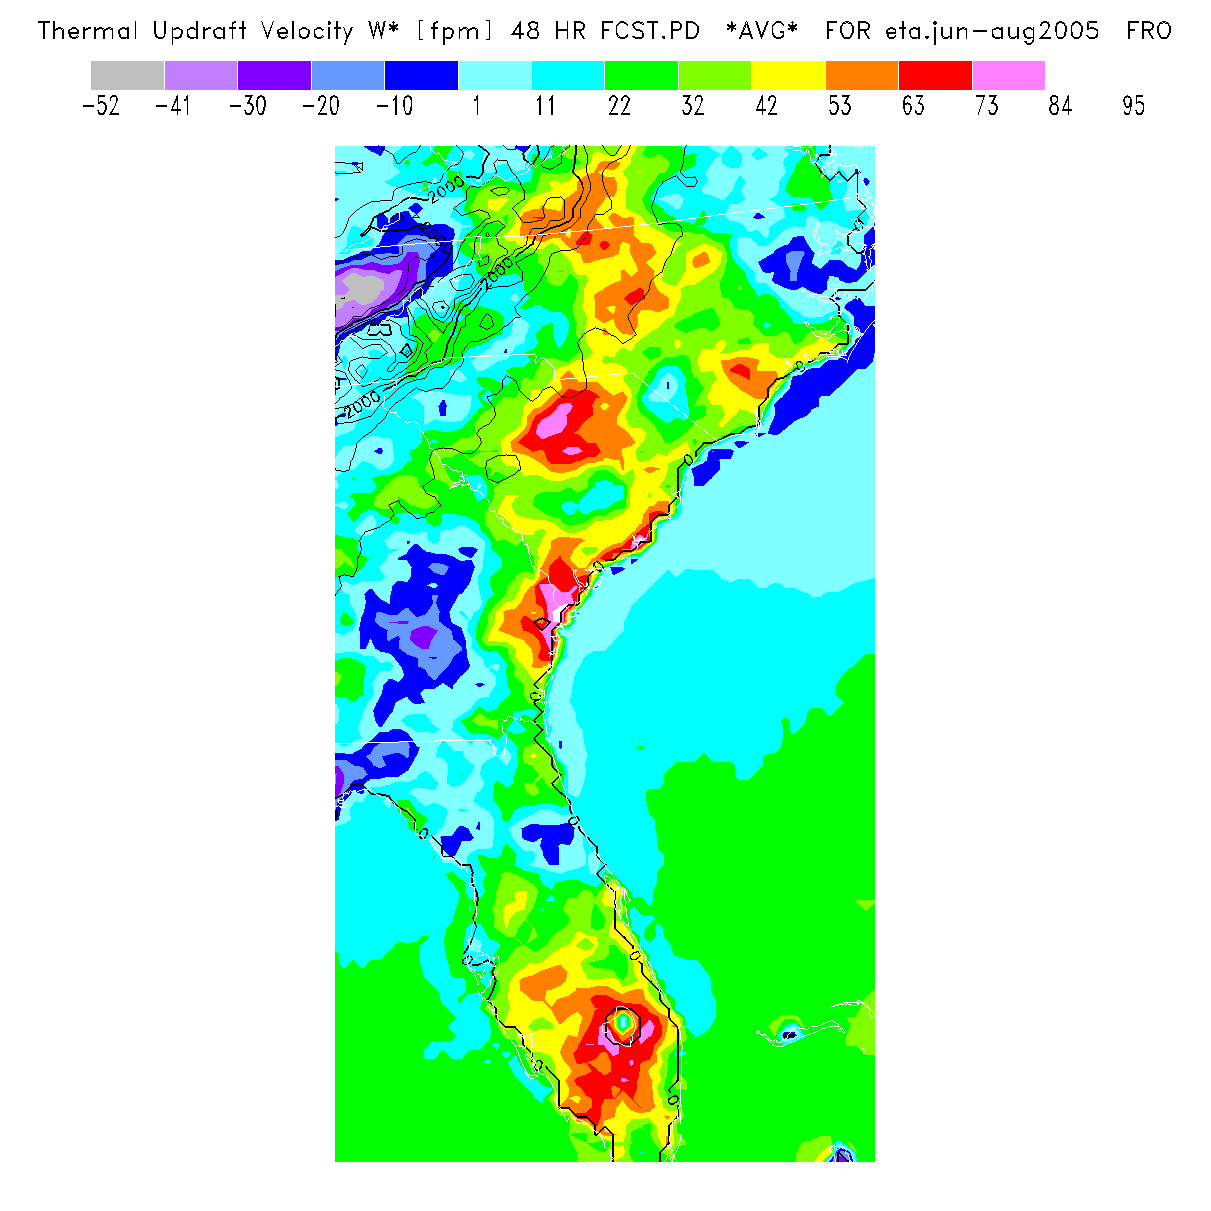
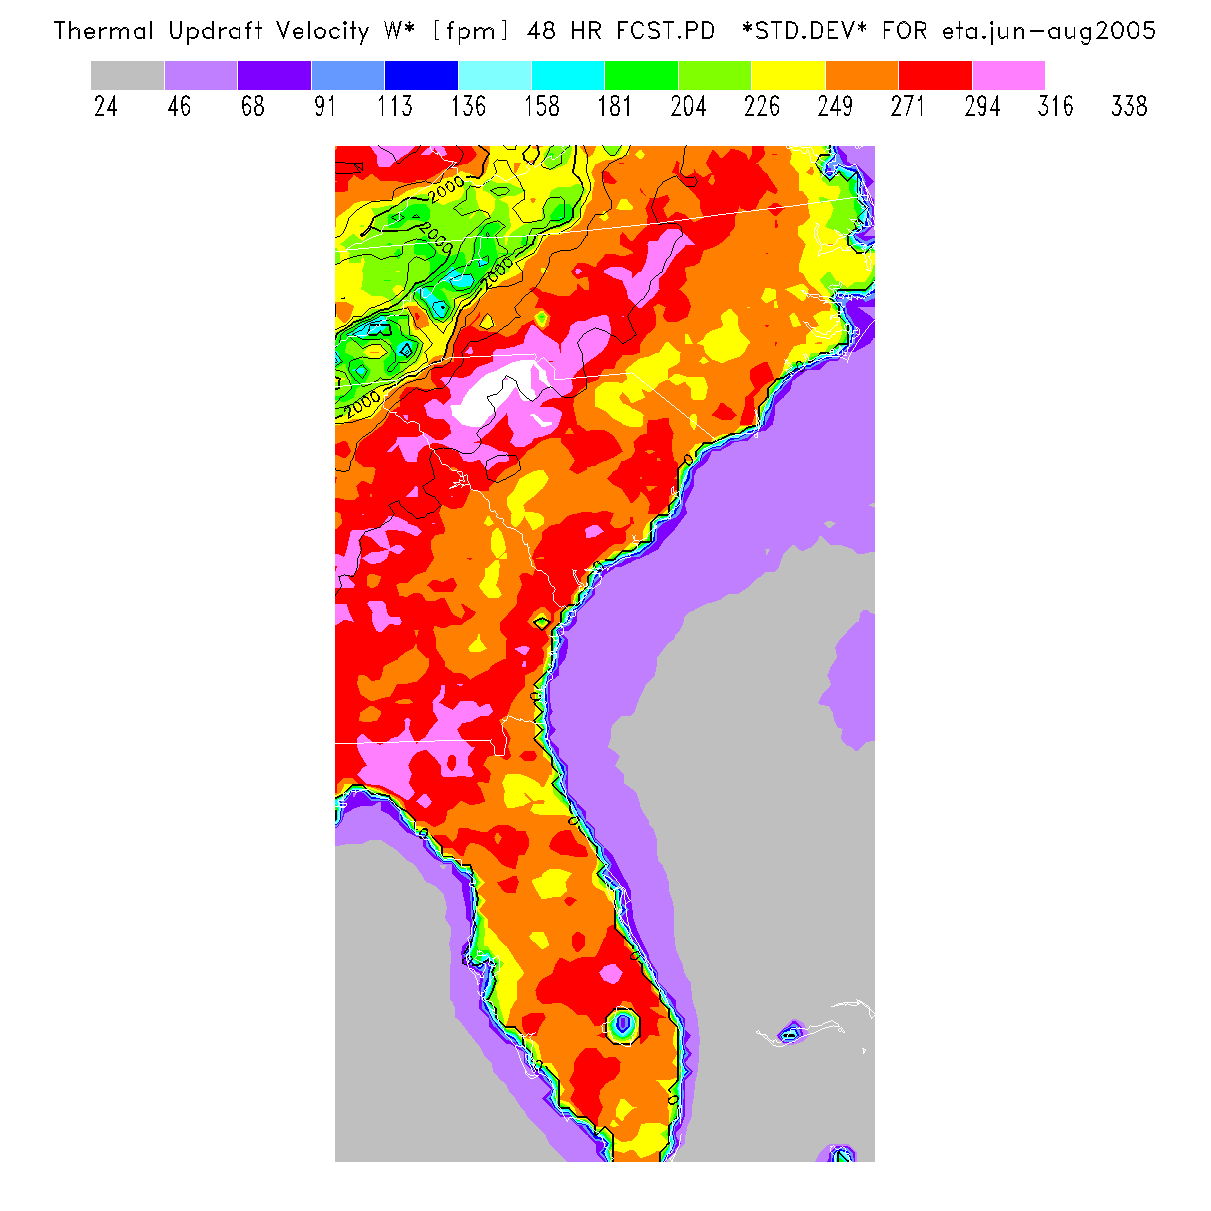
-11
2D Plot |
197
2D Plot |
| Surface Temperature |
-0.4
2D Plot |
6.6
2D Plot |
-0.1
2D Plot |
8.4
2D Plot |
SC Region
(18Z)
| Parameter |
Current+1 Bias |
Current+1 Std.Dev. |
Current+2 Bias |
Current+2 Std.Dev. |
| BL Depth |
+101
2D Plot |
3154
2D Plot |
+195
2D Plot |
3640
2D Plot |
| Thermal Updraft Velocity |
-9
2D Plot |
226
2D Plot |
0
2D Plot |
249
2D Plot |
| Surface Temperature |
-0.2
2D Plot |
6.1
2D Plot |
0.0
2D Plot |
7.4
2D Plot |